Download
1 / 47
490 likes | 684 Views
Populations II: population growth and viability. Bio 415/615. Questions. 1. What are two objectives of population viability analysis (PVA)? 2. In a population projection matrix, what do the row and column values represent?

E N D
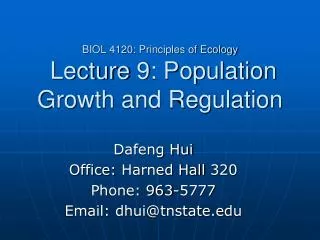
Populations II: population growth and viability Bio 415/615
Questions 1. What are two objectives of population viability analysis (PVA)? 2. In a population projection matrix, what do the row and column values represent? 3. In a stage-structured model, what else can happen to an individual besides growing, dying, and reproducing? 4. What is the parameter lambda (λ), and how does it relate to PVA? 5. How do stochastic and deterministic models differ?
Managing rare species • Those tasked with protecting rare species are primarily concerned with whether populations are VIABLE—will they persist long into the future? • We can use models of how populations grow (births and deaths) to determine population viability.
Assumption of equal individuals • How have we defined population growth so far? • Births (fecundity) and Deaths (survival) • fast growing populations can have lots of births, or few deaths • What did we assume about the chance of births and deaths among individuals? • Constant. • Can we adequately model populations this way? • Can we manage populations this way?
More detail needed: accounting for age In our logistic and exponential models, we considered b and d for all individuals simultaneously. Now we assign b and d to specific age classes. Instead of per capita birth and death rates, we term these FECUNDITY: average number of offspring per individual of certain age in one time interval SURVIVAL: probability of moving from one age to the next These are akin to births per age class and the inverse of deaths per age class.
Age-structured model Standard population trajectory: N(3) = 40 N(4) = 80 N(1) = 10 N(2) = 20 t = 1 t = 2 t = 3 t = 4 Age-structured trajectory: N0(1) = 5 N1(1) = 2 N2(1) = 2 N3(1) = 1 N0(2) = 10 N1(2) = 4 N2(2) = 4 N3(2) = 2 N0(3) = 20 N1(3) = 8 N2(3) = 8 N3(3) = 4 N0(4) = 40 N1(4) = 16 N2(4) = 16 N3(4) = 8 Column of values is avector.
Still have assumptions • Individuals of same age are identical • Closed population (no dispersal or emigration) • Equal sex ratio (esp. for fecundity) • Some assumptions that can be relaxed: • Density dependence (how do survival and fecundity parameters depend on density?) Often ignored with rare populations. • Stochasticity: demographic and environmental • Often added for PVA
Example: helmeted honeyeater Endangered bird endemic to Victoria, Australia eucalypt swamps.
Example: helmeted honeyeater Data: 4 years of population censuses Ages determined for all individuals Individuals start breeding at age 1
Example: helmeted honeyeater 1. Calculate survival Sx is the proportion of individuals in one year that make it to the next Can use weighted mean for the overall Sx , and variance
Example: helmeted honeyeater 2. Calculate fecundities Can calculate Fx as the offspring produced in the next year, divided by all reproductive individuals Can we get other information to calculate age-specific fecundities?
Example: helmeted honeyeater 3. Create Leslie matrix What are rows and columns? • Leslie matrix (L) is a method of matrix multiplication Once S and F for all age classes are known, we can predict age distribution of next year Look familiar?
Example: helmeted honeyeater Fx Sx Can now use this matrix as a projection matrix to predict age structure given any starting conditions.
Stable age distribution If the matrix elements stay the same, then regardless of the initial age structure, the proportion of species of each age will equilibrate.
Stable age distribution But the population overall can be growing, declining, or stable! A matrix property called the dominant eigenvalue is equal to lambda.
Is age always the most critical difference between individuals? • Age versus size: • Modular organisms (plants) • Age is sometimes difficult to measure, but size is relatively easy • If reproduction or survival is based more on environmental circumstances, then age may be a poor correlate of vital rates (eg, trees in an understory) • Can we construct similar models using stages, rather than ages?
Stage (size)-structured models • Demographic (vital) rates best described by size or life stage • Other assumptions still apply (density independence, stochasticity, within-class equality, etc)
Age vs. stage Differences?
Age vs. stage Now individuals can grow, die, reproduce, do nothing (stasis), or get smaller (retrogression)!
Silene regia G3 (rare): 20-100 populations
Modeling transitions Determine life stages seedling vegetative small flwr med flwr large flwr
Modeling transitions seedling 0% vegetative small flwr 11% med flwr 51% stasis 61% large flwr 67%
Modeling transitions seedling 0% vegetative small flwr 11% med flwr 51% 30% 57% 61% large flwr growth 21% 67% 4%
Modeling transitions seedling 0% vegetative small flwr 11% med flwr 51% 30% 57% 61% large flwr growth 21% 67% 11% 4% 1%
Modeling transitions seedling retrogression 17% 0% vegetative small flwr 14% 11% med flwr 51% 30% 17% 57% 61% large flwr growth 21% 67% 11% 4% 1%
Modeling transitions fecundity seedling retrogression 5.3 12.7 17% 0% vegetative small flwr 30.9 14% 11% med flwr 51% 30% 17% 57% 61% large flwr growth 21% 67% 11% 4% 1%
Modeling transitions = Projection matrix
Modeling transitions = Projection matrix Simulation: can be deterministic or stochastic
Modeling transitions = Projection matrix Simulation: can be deterministic or stochastic Deterministic: result does not depend on initial conditions
Modeling transitions = Projection matrix 1. Define initial conditions Seedlings: 500 Vegetative: 100 Small flowering: 100 Med flowering: 100 Large flowering: 100 2. Iterate based on transition probabilities
Modeling transitions fecundity seedling retrogression 5.3 12.7 17% 0% vegetative small flwr 30.9 14% 11% med flwr 51% 30% 17% 57% 61% large flwr growth 21% 67% 11% 4% 1%
Population stochasticity • What is stochasticity? • Deterministic processes leave nothing to chance • Stochastic models are, to some extent, unpredictable • Why do we model stochasticity? • Because even though the expectation might not change, outcomes can depend on amount of uncertainty
Types of population stochasticity • Environmental stochasticity • Births and deaths depend on the environment in a known way, but the environment is itself unpredictable • Demographic stochasticity • Order of births and deaths may fluctuate, even if the rate is generally constant
Stochastic parameters: mean and variance • Mean is the expected value; would be the ‘typical’ outcome if you repeated the process many times • Variance describes how unpredictable the expected outcome is
Stochastic parameters: mean and variance The outcome of stochastic population change depends on both the expected pattern (mean) and the amount of uncertainty involved (variance)! Eg, if the variance is twice as great as the expected (mean) value of r, extinction is very likely.
Stochastic parameters: mean and variance Is demographic stochasticity more important at high or low population sizes? Why? P(extinction) = (d/b)^No
Modeling transitions = Projection matrix • How could we make this projection model stochastic? • Choose years randomly • Choose parameters from a sampling distribution
Population viability analysis (PVA) • Is a population sustainable, and how is it to be sustained? • Several objectives: • Targeting research: which factors are most relevant to extinction probability? • Assessing vulnerability: which populations or species are of immediate conservation concern? • How to manage rarity: what are the relative effects of reintroduction, translocation, weed control, burning, captive breeding, etc?
Population viability analysis (PVA) What is a viable population? A population that can perpetuate itself Minimum viable population – estimate of the # of individuals needed to perpetuate a population: 1) For a given length of time, e.g. for 100 or 1000 years 2) With a specified level of certainty, e.g. 95% or 99%
Minimum Viable Population – Schaffer (1981) Formal Definition: For any given species in any given habitat the MVP is, the smallestisolatedpopulation having a 99% chance of remaining extant for 1000 years despite the foreseeable effects of demographic, environmental, and genetic stochasticity, and natural catastrophes
“How large must a grizzly bear population be to remain viable, unthreatened, and naturally regulated?” i.e. persist i.e. exceed the official threatened standard of <100 bears i.e. in the face of environmental and demography stochasticity
Data: demographic parameters for different bear populations Survival by age maternity Fecundity by age Age of first and last birth Lambda (λ) What is interesting about mast and non-mast years? This is a measure of variability between sites. Why is this important? How is it used?
Resulting Leslie matrix Mean fecundity by age Mean survival by age PVA results from matrix Threatened! Viable
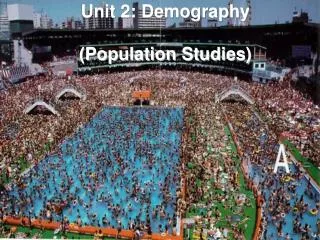
Examples of Minimum Viable Populations – Bighorn Sheep in the southwestern U.S.
Examples of Minimum Viable Populations – Channel Island Birds (California)
Four threats to small populations: • Loss of genetic variability • Demographic variation • Environmental variation • Natural catastrophes