Download
1 / 25
250 likes | 495 Views
Chapter 12 Structure Determination: Mass Spectrometry and Infrared Spectroscopy. Why this Chapter?. Finding structures of new molecules synthesized is critical To get a good idea of the range of structural techniques available and how they should be used.

E N D
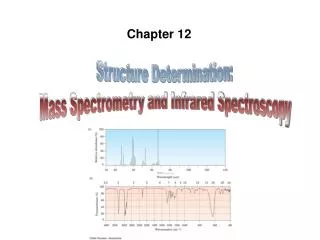
Chapter 12Structure Determination: Mass Spectrometry and Infrared Spectroscopy
Why this Chapter? • Finding structures of new molecules synthesized is critical • To get a good idea of the range of structural techniques available and how they should be used
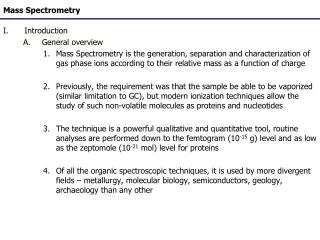
12.1 Mass Spectrometry of Small Molecules: Magnetic-Sector Instruments • Measures molecular weight • Sample vaporized and subjected to bombardment by electrons that remove an electron • Creates a cation radical • Bonds in cation radicals begin to break (fragment) • Charge to mass ratio is measured
The Mass Spectrum • Plot mass of ions (m/z) (x-axis) versus the intensity of the signal (roughly corresponding to the number of ions) (y-axis) • Tallest peak is base peak (100%) • Other peaks listed as the % of that peak • Peak that corresponds to the unfragmented radical cation is parent peak or molecular ion (M+)
Other Mass Spectral Features • If parent ion not present due to electron bombardment causing breakdown, “softer” methods such as chemical ionization are used • Peaks above the molecular weight appear as a result of naturally occurring heavier isotopes in the sample • (M+1) from 13C that is randomly present
Interpreting Mass-Spectral Fragmentation Patterns • The way molecular ions break down can produce characteristic fragments that help in identification • Serves as a “fingerprint” for comparison with known materials in analysis (used in forensics) • Positive charge goes to fragments that best can stabilize it
Mass Spectral Fragmentation of Hexane • Hexane (m/z = 86 for parent) has peaks at m/z = 71, 57, 43, 29
12.3 Mass Spectrometry of Some Common Functional Groups Alcohols: • Alcohols undergo -cleavage (at the bond next to the C-OH) as well as loss of H-OH to give C=C
Mass Spectral Cleavage of Amines • Amines undergo -cleavage, generating radicals
Fragmentation of Carbonyl Compounds • A C-H that is three atoms away leads to an internal transfer of a proton to the C=O, called the McLafferty rearrangement • Carbonyl compounds can also undergo cleavage
12.5 Spectroscopy and the Electromagnetic Spectrum • Radiant energy is proportional to its frequency (cycles/s = Hz) as a wave (Amplitude is its height) • Different types are classified by frequency or wavelength ranges
Absorption Spectra • An organic compound exposed to electromagnetic radiation can absorb energy of only certain wavelengths (unit of energy) • Transmits energy of other wavelengths. • Changing wavelengths to determine which are absorbed and which are transmitted produces an absorption spectrum
12.6 Infrared Spectroscopy • IR region lower energy than visible light (below red – produces heating as with a heat lamp) • IR energy in a spectrum is usually measured as wavenumber (cm-1), the inverse of wavelength and proportional to frequency • Specific IR absorbed by an organic molecule is related to its structure
Infrared Energy Modes • IR energy absorption corresponds to specific modes, corresponding to combinations of atomic movements, such as bending and stretching of bonds between groups of atoms called “normal modes” • Corresponds to vibrations and rotations
12.7 Interpreting Infrared Spectra • Most functional groups absorb at about the same energy and intensity independent of the molecule they are in • IR spectrum has lower energy region characteristic of molecule as a whole (“fingerprint” region)
4000-2500 cm-1 N-H, C-H, O-H (stretching) 3300-3600 N-H, O-H 3000 C-H 2500-2000 cm-1 CºC and C º N (stretching) 2000-1500 cm-1 double bonds (stretching) C=O 1680-1750 C=C 1640-1680 cm-1 Below 1500 cm-1 “fingerprint” region Regions of the Infrared Spectrum
Differences in Infrared Absorptions • Bond stretching dominates higher energy modes • Light objects connected to heavy objects vibrate fastest: C–H, N–H, O–H • For two heavy atoms, stronger bond requires more energy: C º C, C º N > C=C, C=O, C=N > C–C, C–O, C–N, C–halogen
12.8 Infrared Spectra of Some Common Functional Groups Alkanes, Alkenes, Alkynes • C-H, C-C, C=C, C º C have characteristic peaks • absence helps rule out C=C or C º C
IR: Aromatic Compounds • Weak C–H stretch at 3030 cm1 • Weak absorptions 1660 - 2000 cm1 range • Medium-intensity absorptions 1450 to 1600 cm1 • See spectrum of phenylacetylene, Figure 12.15
IR: Alcohols and Amines • O–H 3400 to 3650 cm1 • Usually broad and intense • N–H 3300 to 3500 cm1 • Sharper and less intense than an O–H
IR: Carbonyl Compounds • Strong, sharp C=O peak 1670 to 1780 cm1 • Exact absorption characteristic of type of carbonyl compound • 1730 cm1 in saturated aldehydes • 1705 cm1 in aldehydes next to double bond or aromatic ring
C=O in Ketones • 1715 cm1 in six-membered ring and acyclic ketones • 1750 cm1 in 5-membered ring ketones • 1690 cm1 in ketones next to a double bond or an aromatic ring C=O in Esters • 1735 cm1 in saturated esters • 1715 cm1 in esters next to aromatic ring or a double bond
Let’s Work a Problem Propose structures for a compound that fits the following data: It is an alcohol with M+ = 88 and fragments at m/z = 73, m/z = 70, and m/z = 59
Answer Answer: We must first decide on the the formula of an alcohol that could undergo this type of fragmentation via mass spectrometry. We know that an alcohol possesses an O atom (MW=16), so that leads us to the formula C5H12O for an alcohol with M+ = 88, with a structure of: One fragmentation peak at 70 is due to the loss of water, and alpha cleavage can result in m/z of 73 and 59.