Chi-Squared Analysis: Detecting Statistical Significance
Learn how Chi-Squared Analysis can reveal if outcomes are due to chance or deliberate manipulation. Understand degrees of freedom, p-values, and interpreting X2 values for confident conclusions.


Chi-Squared Analysis: Detecting Statistical Significance
E N D
Presentation Transcript
Chi-Squared Analysis Stickrath
Chi-Squared Analysis • Suppose I bet you $1,000 that I can predict whether heads or tails will turn up each time you flip a coin. • The first time I say, “heads” you flip the coin and it is heads. • I got lucky • The second time I say, “heads” you flip the coin and it is heads
Chi-Squared Analysis • The third time, fourth time, fifth time, sixth time, seven time, eighth time, and so on I predict heads. Each time you flip heads. • At what point do you suspect that I am using a two-headed coin? • When do you stop chalking it up to chance and accuse me of using a two-headed coin? • You can use statistics to back up your accusations and save yourself $1,000
Chi-Squared Analysis • Start with the assumption (null-hypothesis) that the results of the coin flip are due to chance • It is easier to disprove something than to prove it • You will attempt to disprove your null-hypothesis • By showing that it is NOT due to chance you can accuse me of cheating
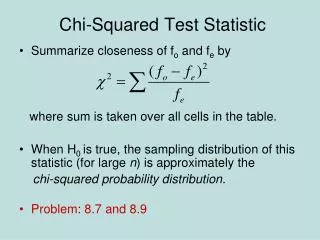
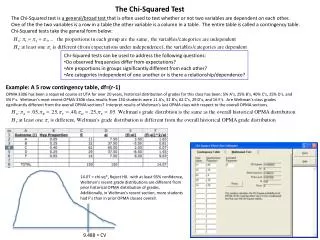
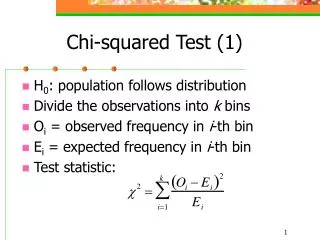
Chi-Square Test • Comparison of observed results and expected results • Null-hypothesis: It is purely due to chance • X2 value = Sum of (Observed – Expected)2 Expected • X2 value = 20
What if we do a second experiment with a new coin and obtain the results below • Null-hypothesis: It is purely due to chance • X2 value = Sum of (Observed – Expected)2 Expected • X2 value = 0.2
What conclusion would you make from the data for the two coins? • Which data is legitimately due to chance, and which data is not due to chance? • In the case of the first coin (two-headed) the chi-squared (X2) value is 20 • In the case of the second coin (regular) the chi-squared (X2) value is 0.2 • So, the higher the (X2) value…the _______ likely the results are due to chance • The lower the (X2) value…the _______ likely the results are due to chance
How low is low enough? • The null-hypothesis is that your results are due to chance • You are attempting to disprove the null-hypothesis • It is easier to disprove something than to prove it • How can chi-squared (X2) analysis be used to disprove the null-hypothesis • There’s an app for that (actually a chart) • To follow the chart you must know two things • Degrees of Freedom • p-value
Degrees of Freedom • The number of values in the final calculation of a statistic that are free to change • Let’s say I give you 4 numbers and tell you that they must add up to 100. In addition, I tell you that one of the numbers is 50. • The three remaining numbers could be a variety of values as long as the overall total is 100 Choice 1Choice 2Choice 3 Number 1 = 50 Number 1 = 50 Number 1 = 50 Number 2 = 30 Number 2 = 5 Number 2 = ? Number 3 = 10 Number 3 = 25 Number 3 = ? Number 4 = 10 Number 4 = 20 Number 4 = ?. • There are many more choices that fulfill the conditions
Degrees of Freedom • In the example above you have 4 options, one of which is a fixed value (50) • 3 numbers are free to change • 3 degrees of freedom • What if I said you have 5 options, one of which is a fixed value (50) • 4 numbers are free to change • 4 degrees of freedom • The more options you have, the more degrees of freedom you have • Generally, in biology degrees of freedom = # categories -1
p-value • The null-hypothesis is that your results are due to chance • p-value: probability that the null-hypothesis is valid (true) • High p-value means null-hypothesis is true • Low p-value means that the null-hypothesis is untrue • How low is low enough? • The significant p-value is 0.05 (5%) • A p-value less than 0.05 means that it is less than 5% likely that the results are due to chance • A p-value greater than 0.05 means that it is more than 5% likely that the results are due to chance
Two-headed coin Big X2 = Small p-value = Not due to chance = Statistically Significant Data • The X2 value for our two-headed coin was 20 • The number of options were 2 (heads or tails) = 1 degree of freedom • The significant p-value is always 0.05 or less • Critical value for 1 degree of freedom is 3.84 • 20 is greater than 3.84 so p-value is less than 0.05 Big X2 = Small p-value = Not due to chance = Statistically Significant Data 20 = 0.000001 = Not due to chance = Statistically significant
Regular coin Small X2 = Large p-value = Due to chance = Statistically Insignificant Data • The X2 value for our two-headed coin was 0.2 • The number of options were 2 (heads or tails) = 1 degree of freedom • The significant p-value is always 0.05 or less • Critical value for 1 degree of freedom is 3.84 • 0.2 is lower than 3.84 so p-value is more than 0.05 Small X2 = Large p-value = Due to chance = Statistically Insignificant Data 0.2 = 0.65 = Due to chance = Statistically insignificant
Simple vs. Complex • In the case of the two-headed coin, you have simple expectations 50:50 heads to tails • What about more complex problems?
Teaching Example • 100 students took my exam • X2 =11.93 • Degrees of Freedom = # categories -1 = 5-1 = 4
Did my student meet my expectations? • X2 =11.93 • Degrees of Freedom = # categories -1 = 5-1 = 4