Download

1 / 19
190 likes | 340 Views
Terrestrial emissions of isoprene. Paul Palmer Division of Engineering and Applied Sciences, Harvard University. http://www.people.fas.harvard.edu/~ppalmer. hv. O 3. NO 2. NO. OH. HO 2. HC+OH HCHO + products. NOx, HC, CO. Tropospheric O 3 is an important climate forcing agent.

E N D
Terrestrial emissions of isoprene Paul Palmer Division of Engineering and Applied Sciences, Harvard University http://www.people.fas.harvard.edu/~ppalmer
hv O3 NO2 NO OH HO2 HC+OH HCHO + products NOx, HC, CO Tropospheric O3 is an important climate forcing agent Level of Scientific Understanding Natural VOC emissions (50% isoprene) ~ CH4 emissions. IPCC, 2001
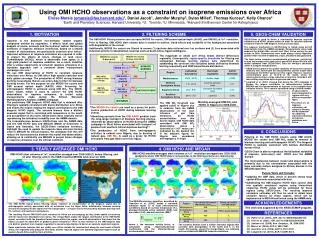
GEIA EPA BEIS2 7.1 Tg C 2.6 Tg C MEGAN [1012 atom C cm-2 s-1] 3.6 Tg C Isoprene emissions July 1996 Isoprene oxidation products (e.g. HCHO) provide constraints on estimated emissions
GOME isoprene emissions (July 1996) agree with surface measurements ppb 0 12 r2 = 0.53 Bias -3% r2 = 0.65 Bias -30% BEIS2 GEIA Modeled HCHO [ppb] Observed HCHO [ppb]
LAI Sep April Modeling the terrestrial biosphere PAR – direct and diffuse (GMAO) Temperature: Instantaneous (G95) 10-day avg (Petron ‘01) Fixed base emission factors (Guenther 2004) Canopy model (Guenther 1995) Altitude Emission MODIS/AVHRR LAI Emissions
GEOS-CHEM Global 3D CTM PAR, T Emissions MODEL BIOSPHERE MEGAN (isoprene) Canopy model Leaf age LAI Temperature Base factors GEIA Monoterpenes MBO Acetone Methanol Global 3-D Modeling Overview • Driven by NASA GMAO met data • 2x2.5o resolution/30 vertical levels • O3-NOx-VOC-aerosol chemistry Monthly mean LAI (AVHRR/MODIS)
Monoterpenes Isoprene MBO May Jun Jul Aug Sep VOC emissions during 2001 growing season [1012 atom C cm-2 s-1]
NOx = 1 ppb NOx = 0.1 ppb 0.4 pinene ( pinene similar) DAYS HCHO production from biogenics using the MCM Y become closer at t progresses further isoprene 0.5 0.33 Cumulative HCHO yield [per C] GEOS-CHEM HOURS Use this analysis to parameterise source of HCHO from monoterpenes Mike Pilling and Jenny Stanton, Leeds University
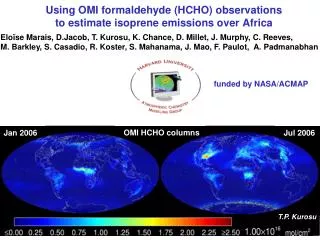
Global Ozone Monitoring Experiment • Nadir-viewing SBUV instrument • Pixel 320 x 40 km2 • 10.30 am cross-equator time (globe in 3 days) • O3, NO2, BrO, OClO, SO2, HCHO, H2O, cloud • HCHO slant columns fitted: 337-356nm • Fitting uncertainty < continental signals Isoprene Biomass Burning HCHO JULY 1997
GEOS-CHEM GEOS-CHEM GOME GOME May Aug Jun Sep Jul GROWING SEASON 2001 HCHO column [1016 molec cm-2] HCHO column signal from monoterpenes is comparable to GOME column uncertainty
HCHO data over the Ozarks SOS 1999 Aircraft data @ 350 m July 1999 Illinois Missouri Kansas OZARKS [ppb] GOME c/o Y-N. Lee, Brookhaven National Lab. [1016 molec cm-2]
kHCHOHCHO EVOC = _______________ kVOCYieldVOCHCHO hours WHCHO hours Isoprene HCHO h, OH OH a-pinene propane VOC 100 km Distance downwind VOC source Relating HCHO Columns to VOC Emissions Master Chemical Mechanism
Wind direction associated with largest [HCHO] in 1998 intensive EVALUATE GOME DATA USING LONG-TERM ISOPRENE FLUX DATA PROPHET RESEARCH SITE (MI) Maple, beech, birch, basswood, mixed aspen, bog conifers (lower, wet areas), and pine and red oak (drier upland regions). Average height near 20 m. Overstory age of the hardwood forest is approximately 75 years.
Isoprene flux [1012 molec cm-2 s-1] Measured (WSU) MEGAN GOME Using observed isop flux:HCHO column regression better agreement with GOME Long term in situ isoprene flux measurements at PROPHET site during 2001 Isoprene flux [1012 molec cm-2 s-1] Measured (WSU) MEGAN GOME HCHO column [1016 molec cm-2] +/- uncertainty Y2K1 Day
May July June September August 1996 1997 1998 1999 2000 2001 HCHO column [1016 molec cm-2]
Interannual variability of the seasonal cycle GOME HCHO Column [1016 molec cm-2] Southeast US 32-38N; 265-280W Days 2K1
GOME HCHO Column [1016 molec cm-2] r = 0.75 n=14 PAMS (EPA) Isoprene Concentration (10-12 LT) [ppbC] In situ observations over Atlanta GA provide some verification of large interannual variability Mean values associated with individual values > 30 ppbC Lance McCluney, EPA
What is driving this variability? 2nd-order polynomial fit to HCHO columns Curve based on greenhouse data (Guenther) r=0.9
Closing Remarks • GOME HCHO data provide constraints on natural VOC emissions • Data consistent with seasonal and interannual variability observed with in situ measurements • Improved understanding and quantification of air quality and climate • Just the beginning…need to relate model-observation discrepancy to a better understanding of the underlying processes