Download
1 / 1
10 likes | 128 Views
Isoprene emissions in Africa inferred from OMI HCHO. Eloïse Marais (emarais@fas.harvard.edu) 1 , D. Jacob 1 , T. Kurosu 2 , K. Chance 3 , J. Murphy 4 , C. Reeves 5 , G. Mills 5 , S. Casadio 6 , D. Millet 7 , M. Barkley 8 , F. Paulot 1 , J. Mao 9

E N D
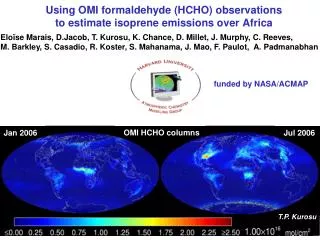
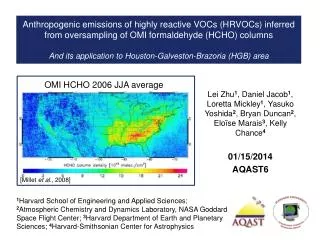
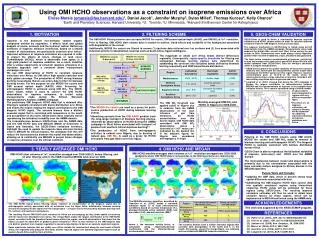
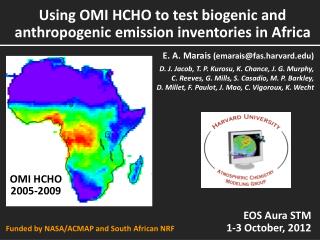
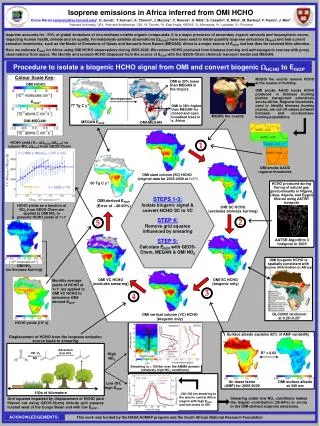
Isoprene emissions in Africa inferred from OMI HCHO Eloïse Marais (emarais@fas.harvard.edu)1, D. Jacob1, T. Kurosu2, K. Chance3, J. Murphy4, C. Reeves5, G. Mills5, S. Casadio6, D. Millet7, M. Barkley8, F. Paulot1, J. Mao9 1Harvard University, 2JPL, 3Harvard-Smithsonian, CfA, 4U. Toronto, 5U. East Anglia, 6IDEAS, 7U. Minnesota, 8U. Leicester, 9U. Princeton Isoprene accounts for ~50% of global emissions of non-methane volatile organic compounds. It is a major precursor of secondary organic aerosols and tropospheric ozone, impacting human health, climate and air quality. Formaldehyde satellite observations (HCHO) have been used to better quantify isoprene emissions (EISOP) and test current emission inventories, such as the Model of Emissions of Gases and Aerosols from Nature (MEGAN). Africa is a major source of EISOP, but has thus far received little attention. Here we estimate EISOP for Africa using OMI HCHO observations during 2005-2009. We remove HCHO produced from biomass burning and anthropogenic sources with proxy observations from space. We identify and exclude HCHO displaced from the source of EISOP with the GEOS-Chem chemical transport model and MEGAN. Procedure to isolate a biogenic HCHO signal from OMI and convert biogenic HCHO to EISOP Colour Scale Key: MODIS fire counts remove HCHO at the source of burning. OMI smoke AAOD tracks HCHO produced in biomass burning plumes transported extensively across Africa. Regional thresholds, used to identify biomass burning plumes, are cut-off values between biomass- and non-biomass- burning populations. OMI is 33% lower than MEGAN in the tropics OMI HCHO: discrepancies EISOP: 77 Tg C y-1 OMI is 38% higher than MEGAN for closed and open broadleaf trees in s. Africa MODIS fire counts OMI-MEGAN: MEGAN EISOP OMI-MEGAN 1 HCHO yield (S = HCHO/EISOP) vs column NO2 (NO2) from GEOS-Chem OMI smoke AAOD regional thresholds OMI slant column (SC) HCHO (original data for 2005-2009 at 11°) 60 Tg C y-1 HCHO produced during flaring of natural gas(predominantly in Nigeria, Libya, Algeria, and Egypt) filtered using AATSR hotspots STEPS 1-3:Isolate biogenic signal & convert HCHO SC to VC STEP 4:Remove grid squares influenced by smearing STEP 5:Calculate EISOP with GEOS-Chem, MEGAN & OMI NO2 OMI-derived EISOP (Error of ~40-90%) HCHO yields as a function of NO2 from GEOS-Chem are applied to OMI NO2 to generate HCHO yields at 11° OMI SC HCHO (excludes biomass burning) 2 5 AATSR Algorithm 3 hotspots in 2005 OMI biogenic HCHO is spatially consistent with biome distribution in Africa OMI NO2 (no biomass burning) OMI SC HCHO (biogenic only) OMI VC HCHO (excludes smearing) Monthly-average yields of HCHO at 11° are applied to OMI VC HCHO to determine OMI-derived EISOP 3 4 GLC2000 landcover at 0.250.25° OMI vertical column (VC) HCHO (biogenic only) HCHO yields [103 s] Surface albedo explains 62% of AMF variability Displacement of HCHO from the isoprene emission source leads to smearing Advection (low OH) R2 = 0.62 HighNOx OH, O2 NO Smearing is < 100 km over the AMMA domain (relatively high NOx conditions) OMI surface albedo at 345 nm Air mass factor (AMF) for 2005-2009 Low OH; high EISOP 100s of kilometers ~200-300 km smearing to the west in central Africa (region with high EISOP and low levels of OH) Smearing under low NOx conditions makes the largest contribution (35-84%) to errors in the OMI-derived isoprene emissions. Grid squares impacted by displacement of HCHO (and filtered out using GEOS-Chem) include grid squares located west of the Congo Basin and with low EISOP . ACKNOWLEDGEMENTS: This work was funded by the NASA ACMAP program and the South African National Research Foundation