Download
1 / 39
390 likes | 493 Views
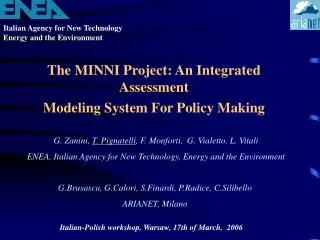
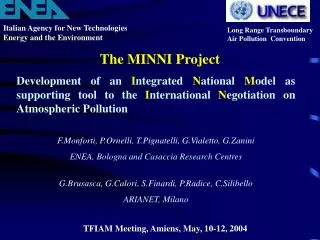
Italian-Polish workshop - Warsaw, 17 March 2006. MINNI Project outcomes: downscalings for regional policy support. G. Calori. ARIANET s.r.l. via Gilino, 9 – 20128 Milano (MI) – ITALY - tel. 02.27007255 – fax 02.25708084 – http://www.aria-net.it. Air quality assessment: EU context.

E N D
Italian-Polish workshop - Warsaw, 17 March 2006 MINNI Project outcomes: downscalings for regional policy support G. Calori ARIANET s.r.l. via Gilino, 9 – 20128 Milano (MI) – ITALY - tel. 02.27007255 – fax 02.25708084 – http://www.aria-net.it
Air quality assessment: EU context • “Framework” Directive on ambient air quality assessment and management (96/62/EC) and Daughter Directives • (1999/30/EC): limit values for SO2, NO2, NOx, PM, Pb • (2000/69/EC): C6H6 and CO • (2002/3/EC): O3 • (2004/107/EC): heavy metals and PAHs • Air quality standards – LV and MOT • Assessment and management: • current status • policy scenarios • Measurements + emission inventory + modelling (on a yearly basis) (“supplementary assesment methods”)
Regional air quality assessment • Italy: regional plans and programmes • Develop coherent evaluations, taking into account: • local features (sources, topography & land-use, meteorology…) • national (and international) context • Model-based + monitoring, to support the design of action plans
MINNI AMS & RAINS-Italy AMS RAINS-Italy 3D atmospheric modelling Integrated assessment modelling (interactive) (off-line) regional downscalings
Regional downscalings: approach Steps: • base-case reconstruction, nested into national-scale • policy(regional / national / EU)detailed future emission scenario • direct 3D simulation with CTM (chemical-transport model – same as MINNI AMS) • comparison and scenario assessment multi-scale, non-linearities, pollutants inter-dependencies Downscaling examples - aspects: • emissions • meteorology • concentrations • scenarios
Regional downscalings Current status Piemonte Veneto x = 4 km x = 4 km N Italy Valle d’Aosta x = 4 km x = 2 km National scale x = 20 km
“Point” “Line” “Area” 107 plants, 735 stacks 67 activities 1401 arcs 8 activities 1286 municipalities 81 activities (ton/year) Piemonte Regional emission inventory (INEMAR)
Foreign EMEP Lombardia INEMAR Piemonte INEMAR National (APAT) Piemonte Emission inventories integration
SPACE DISAGGREGATION TIME MODULATION NMVOC SPECIATION & PM DIM. CLASSES Piemonte Emissions: model input Inventory data (munic.) Thematic data Modulation profiles (daily, weekly, yearly) Residential Highways Deciduous Speciation & dimensional profiles Hourly gridded & speciated emissions
Chemical boundary conditions National- -scale simulation Boundary conditions Regional scale simulation NO2, 18.1.1999 h 09
Piemonte Meteorology Wind Temperature Italy (RAMS) Piemonte (MINERVE)
Piemonte Monitoring network • model verification • combined model-measurements AQ assessment
Station type backg. traffic X ENEL Piemonte Comparison with monitoring data Yearly avg. SO2 NO2 O3 Benzene
Piemonte Comparison with monitoring data Monthly means & avg. days NO2monthly means O3monthly means O3avg. summer day Torino Lingotto Alpignano Biella (via don Sturzo)
Piemonte Yearly assessment Map of indicators: health NO2 Yearly avg. Benzene Yearly avg. Ozone Avg. of 8hr daily max Limit: 5 g m-3 Limit: 120 g m-3, less than 25 days/year Limit: 40 g m-3
Piemonte Yearly assessment Map of indicators: ecosystems NOx Yearly avg. SO2 Yearly avg. Limit: 20 g m-3 Limit: 30 g m-3
Piemonte Future scenarios • vehicles fleet at year 2008 • introduction of selective traffic ban zones (ZTL) for municipalities above 10000 inhabitants • building heating sector: implementation of rules on fuel use and boilers + growth/adaptation of buildings stock
Piemonte Scenario: vehicles fleet at year 2008 • Projection of vehicles fleet – Hypothesis: • use of “age curves” for gasoline and diesel vehicles • future sells (2004-2008): same gasoline/diesel partition (51% vs. 49%) • Euro IV (COPERT III methodology) Example: gasoline cars > 1400 cm3 (COPERT classes) . . . . . . . . . .
Piemonte Emissions scenario: vehicles fleet at year 2008 Emissions [t/y] Variation respect to 2003
Piemonte Scenario: vehicles fleet at year 2008 Results on concentrations - 1 NO2 yearly avg. Absolute var. Relative var. Base: year 2001
Piemonte Scenario: vehicles fleet at year 2008 Results on concentrations - 2 O3 hot season AOT40 for vegetation: relative var. Avg. of daily maxima: relative var. Base: year 2001
Veneto Yearly assessment NO2 Yearly avg. O3 AOT40 vegetation Limit: 18000 g m-3 h Limit: 40 g m-3
Veneto Future scenarios • vehicles fleet at year 2010 • construction of Superstrada Pedemontana Veneta (SPV)
Veneto Future emissions scenarios Results on concentrations - 1 NO2 yearly avg. – Absolute var. Vehicles fleet at 2010 Construction of SPV
Veneto Future emissions scenarios Results on concentrations - 2 O3: AOT40 – Relative var. Vehicles fleet at 2010 Construction of SPV
Northern Italy Future scenarios • thermal power plants at year 2010 • introduction of PM retrofit filters on off-road vehicles • -30% reduction of emissions from building heating sector
Northern Italy Base case emissions Diffuse emissions (4 km) + thermal power plants Example of daily winter cycle - NO Processing from APAT 2000 national inventory data
decrease increase newi 15000 kg/day 7500 1500 Northern Italy Thermal power plants at year 2010 - Emissions Variations of NOx emissions Load curves by plant type Data from Ministry of Industry & Authority for Electricity and Gas
Northern Italy Concentrations Example: SO2 Isosurfaces at 10 and 20 ppb 27 54
Northern Italy Power plants scenario: results on concentrations - 1 Base case NO2 avg., winter ppb Variations ppb
Northern Italy Power plants scenario: results on concentrations - 2 Base case O3 avg. of daily max ppb Variations
Northern Italy Power plants scenario: results on concentrations - 3 Base case PM10 avg., winter Variations
AMS RAINS-Italy 3D atmospheric modelling Integrated assessment modelling (interactive) (off-line) regional scenarios
Current work - 1 Regional scenarios with RAINS-Italy Use of RAINS-Italy to study regional scenarios, harmonized with national framework Regione Piemonte Implementation of: • future regional energy pathways • regional control options Analysis of: • impacts on health & environment • effectiveness
Current work - 2 Direct 3D atmospheric modelling • Whole Italy at 4 km (yearly) • Different year (2003), at 20 and 4 km • …other regions?