Download
1 / 16
160 likes | 207 Views
Dive into the complexities of planetary boundaries, from Malthusian concerns to contemporary issues like ocean pH changes, biodiversity, and global temperatures. Analyze growth patterns, energy consumption, and fertility scenarios for a sustainable future.

E N D
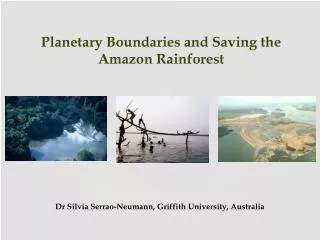
Lecture 6Planetary Boundaries The Age of Sustainable Development
6.1. Thomas Robert Malthus Portrait of Thomas Robert Malthus by John Linnell.
6.2. Ocean pH Changes “Estimated change in annual mean sea surface pH between the pre-industrial period (1700s) and the present day (1990s).” Plumbago. Wikimedia Commons, CC BY-SA 3.0.
6.3. NASA Satellite Image of Ozone Layer (1985) NASA/Goddard Space Flight Center Scientific Visualization Studio.
6.4. Young Boy Swimming in Algal Bloom in Shandong, China Photo: Reuters/China Daily.
6.5. The Living Planet Index of Biodiversity (1970–2000) Source: World Wildlife Fund. 2012. “Living Planet Report 2012.” Gland, Switzerland: WWF International.
6.6. Surface Temperatures in 2013 compared with 1951–80 Source: Calculated at http://data.giss.nasa.gov/cgi-bin/gistemp/nmaps.cgi?sat=4&sst=3&type=anoms&mean_ gen=0112&year1=2013&year2=2013&base1=1951&base2=1980&radius=1200&pol=rob.
6.7. Changes in Global Extreme Temperatures (1955-2011) From Hansen, James, Makiko Sato, and Reto Ruedy. 2012. “Perception of Climate Change.” Proceedings of the National Academy of Sciences 109(37): E2415–E2423.
6.8. Convergence of High Income and Developing Country Growth (2010–2050)
6.9. Global Population on a Semi-Log Scale (1950–2100) Source: United Nations Department of Economic and Social Affairs Population Division (DESA Population Division). 2013. “World Population Prospects: The 2012 Revision.” New York.
6.10. Energy Consumption and Gross Domestic Product per capita Source: U.S. Energy Information Administration, the World Bank.
6.11. Four Fertility Scenarios, World Population Projections (1950–2100) Source: United Nations Department of Economic and Social Affairs Population Division (DESA Population Division). 2013. “World Population Prospects: The 2012 Revision.” New York.
6.12. Average Annual Rate of Population Change by Region (medium fertility scenario) (1950-2100) Source: United Nations Department of Economic and Social Affairs Population Division (DESA Population Division). 2013. “World Population Prospects: The 2012 Revision.” New York.
6.13. Total Fertility Trajectories by Region (medium fertility scenario) (1950–2100) Source: United Nations Department of Economic and Social Affairs Population Division (DESA Population Division). 2013. “World Population Prospects: The 2012 Revision.” New York.