Mathematical modeling
370 likes | 548 Views
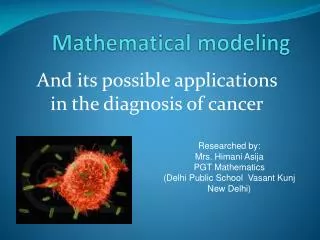
Mathematical modeling. And its possible applications in the diagnosis of cancer. Researched by: Mrs. Himani Asija PGT Mathematics (Delhi Public School Vasant Kunj New Delhi). The Problem. We have the solution to cancer but is it the cure?

Mathematical modeling
E N D
Presentation Transcript
Mathematicalmodeling And its possible applications in the diagnosis of cancer Researched by: Mrs. Himani Asija PGT Mathematics (Delhi Public School Vasant Kunj New Delhi)
The Problem • We have the solution to cancer but is it the cure? • Patient specific titration of the dosage of cancer related drugs is at best a vague field. • Behavior of cancerous cells is seemingly random and unpredictable. It is little understood and therefore, at present inadequately treated.
The Solution • To try and understand how the cogs of a tumor turn; to try and predict how it’ll react to change in it’s environment (the body of the patient). • This allows us to maximize tumor damage and minimize patient damage.
WHERE AND HOW IT STARTED…. • A holiday homework assignment given to children where they had to draw fractals figures of Koch snowflake, Sierpinski’s carpet and Sierpinski’s triangle and find their areas and perimeters at different stages • Generalise the above to the nth stage Koch snowflake LINK : koch snowlfake.gsp Serspenki’s carpet LINK : serspenki.gsp
ABOUT THE PROJECT… • THOSE WHO SAY THAT MATH HOMEWORKS ARE BORING AND FAR FROM REAL WORLD BEWARE!!! • This project is an endeavor not only to talk, discuss, and research about cancer cells, but also correlate the biology of the cells with the mathematics in it. • The project is based on two hypotheses. In the first hypotheses, a dynamic software called the geometer’s sketchpad has been used and for the second hypothesis, MS EXCEL and a freeware Graphmatica has been used.
OBSERVATION -1 Make a Koch snowflake with an equilateral triangle of side x cm. We obtain the following table LINK : KOCH SNOWFLAKE
PERIMETER The perimeters form a geometric progression with common ratio 4/3, which is greater than one 3x, 4x, 16x/3, 48x/9, 192x/27, ………… So, the nth term Tn = 3x(4/3)n-1 which increases infinitely as n increases infinitely. Conclusion: The perimeter of the polygon approaches infinity as n approaches infinity AREA ENCLOSED The area enclosed by the polygon forms a geometric progression with common ratio 4/9, which is less than one (√3/4)x² (1+3/3²+12/9²+48/27² +192/81²+……….) = (√3/4)x² (1+ ) = (√3/4)x² ( 8/5) = (√3/5)2x² = 8/5 times the area of the original triangle THE RATIO OF THE PERMETER SQUARED AND AREA INCREASES INFINITELY AS THE NO. OF SIDES OF THE POLYGON INCREASES INFINITELY NOTE The perimeter has been squared to produce a dimensionless quantity in the ratio Conclusion: The area enclosed by the polygon is finite even when n approaches infinity
OBSERVATION 2 THE RATIO OF PERIMETER SQUARED AND AREA IS MAXIMUM WHEN THE NO. OF SIDES OF A FIGURE IS MINIMUM; IT BEING MAXIMUM FOR A TRIANGULAR FIGURE AND MINIMUM FOR A CIRCLE ( THE NO. OF SIDES OF A CIRCLE IS INFINITE) LINK : FIGURE: CHANGE OF RATIO WITH THE INCREASE IN THE NO. OF SIDES OF THE GEOMETRIC FIGURE
TO BEGIN WITH THE CANCER CELLS… HYPOTHESIS – 1 Cancer cells follow the fractal figure, the Koch Snowflake. The ratio of the square of the perimeter and the area of a normal cell is the least and that of the cell at the advanced stage is the maximum; it increases with the increase in the stage of malignancy.
Normal (non cancerous) human cell gsp\NORMAL CELL.gsp
Cancer cell in preliminary stage gsp\PRELIMINARY STAGE.gsp
Cancer cell in intermediate stage gsp\INTERMIDIATE STAGE.gsp
Cancer cell in advanced stage 1. 3 . gsp\ADVANCED STAGE 3.gsp gsp\ADVANCED STAGE 1.gsp 2. gsp\ADVANCED STAGE 2.gsp
Hypothesis 2 • Fractal dimension by box method is calculated as the slope of the line of best fit obtained by plotting the points • ( Ln(S), Ln (Ne )) where • S is the dimension of the square grid required to cover the picture and • Ne is the no. of boxes of the grid required to cover the picture. Ln is the natural log of the respective values FRACTAL DIMENSIONS BY BOX COUNTING METHOD: OUR HYPOTHESIS IS: THE FRACTAL DIMENSION OF THE NORMAL CELL IS MAXIMUM AND IT REDUCES AS THE STAGE ADVANCES SO HIGHER THE STAGE OF MALIGNANCY, LESS IS THE FRACTAL DIMENSION
Normal Cell (non cancerous) LINK: EXCEL SHEET SCALES
OBTAINING THE LINE OF BEST FIT AND ITS SLOPE BY PLOTING THE POINTS ON THE X-Y AXIS FRACTAL DIMENSION = 2.03 LINK: GRAPHMATICA FILE
Cancer cell in preliminary stage LINK ; EXCEL SHEET SCALES
OBTAINING THE LINE OF BEST FIT AND ITS SLOPE BY PLOTING THE POINTS ON THE X-Y AXIS FRACTAL DIMENSION = 1.82 LINK: GRAPHMATICA FILE
Cancer cell in intermediate stage LINK :EXCEL SHEET SCALES
OBTAINING THE LINE OF BEST FIT AND ITS SLOPE BY PLOTING THE POINTS ON THE X-Y AXIS FRACTAL DIMENSION = 1.73 LINK: GRAPHMATICA FILE
Cancer cell in advanced stage -1 LINK: EXCEL SHEET SCALE
OBTAINING THE LINE OF BEST FIT AND ITS SLOPE BY PLOTING THE POINTS ON THE X-Y AXIS FRACTAL DIMENSION = 1.7 LINK : GRAPHMATICA FILE
Cancer cell in advanced stage-2 LINK : EXCEL SHEETS SCALE
OBTAINING THE LINE OF BEST FIT AND ITS SLOPE BY PLOTING THE POINTS ON THE X-Y AXIS FRACTAL DIMENSION = 1.68 LINK : GRAPHMATICA FILES
Cancer cell in advanced stage-3 LINK: EXCEL SHEET SCALE
OBTAINING THE LINE OF BEST FIT AND ITS SLOPE BY PLOTING THE POINTS ON THE X-Y AXIS FRACTAL DIMENSION = 1.61 LINK : GRAPHMATICA FILE
Other Links for fractal dimensions excel files • Fractal dimension of a rectangle (same as to the topological dimension=2) • Fractal dimension remains same even if the size of the figure under study is reduced/increased.
Limitations of the approach • Making the equations that govern the model is a slow, hit and trial process. • There are always biological fudge factors which are almost impossible to predict and even harder to stimulate. For example: A particular patient’s tumor could develop a unique adaptation mechanism to counter the effects of the chemotherapy and radiation. • Each individual’s body is unique in its own way and it is very difficult to define a model that would give results to the same degree of accuracy for all the patients. For example, a fat person will have a slower and more restricted blood flow, which in turn affects the oxygen supply to the tumor and even how effective a given dosage of drugs will be and whether or not the drugs will reach the intended site in the intended concentration.
Our Resource Limitations • We couldn’t get access to hands-on pictures of cancer cells from doctors and certified hospitals due to the patient privacy policy. So, we had to rely on pictures found on the internet. • Due to our limited knowledge in the field of cellular structure and medicine, we couldn’t satisfactorily explore the biological depth of the subject. • The pictures were converted into polygons, which gave a very approximate shape. For clinical purposes, approximations do not give accurate results. So a better software is needed to apply the concept. • To find the fractal dimension by box counting method was done by using MS EXCEL which does not give very accurate result to be used for diagnostic researches. Software giving more accurate fractal dimension shall be needed to conclude the actual stage of a patient. This was just an attempt to make the students realize how the mathematics they study is so closely related to their lives.
REFERENCES • http://mste.illinois.edu/dildine/cancer/ • Fratals for the classroom , by Evan Maletsky, Terry Perciantae, Lee Yunker • http://cancerres.aacrjournals.org/content/60/14/3683.full.pdf • A free trial version of the soft wares used can be downloaded from the following links: • http://www.keypress.com/x24795.xml (geometer’s sketchpad) • http://www8.pair.com/ksoft/ (graphmatica) CLINICAL JUSTIFICATIONS OF THE HYPOTHESIS http://www.newscientist.com/article/mg15721182.100-fractal-cancer.html
Personal details of the researcher NAME: Himani Asija SCHOOL: Delhi Public School Vasant Kunj ADDRESS: B 804, NPSC Apts., Plot no. 5, Sector-2, Dwarka New Delhi - 110075 CONTACT NO.: 9717160042 E MAIL himaniasija@hotmail.com Blog http://mathemagic-himani.spaces.live.com/