Download
1 / 34
360 likes | 664 Views
Chapter 1. 1.1 Mathematical Modeling. Mathematical Model. A mathematical model is a graphical, verbal, numerical, or symbolic representation of a problem situation. Example- Page 17. 15. Teacher Salary Comparison

E N D
Chapter 1 1.1 Mathematical Modeling
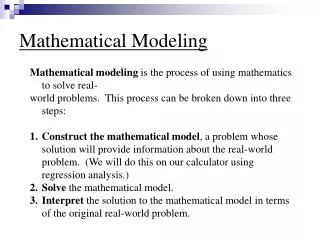
Mathematical Model • A mathematical model is a graphical, verbal, numerical, or symbolic representation of a problem situation.
Example- Page 17 15. Teacher Salary Comparison Over 60% of men not in the teaching profession earn a higher salary than men who are teachers. The table shows how much more money the average college-educated male non-teacher makes as compared to the average male teacher. Source: www.nea.org For example, in 1990 male non-teachers made 37.5% more than male teachers on average.
Example- Page 17 a. Describe the trend observed in these data. b. Why was there such a big jump in the percentage of non-teachers who earn a higher salary than teachers from 1990 to 2000? c. What does the –3.6% in 1940 indicate about salaries of male teachers?
Example- Page 19 18. Super Bowl Ticket Prices The table shows the price of a Super Bowl ticket for selected Super Bowls. (Source: www.superbowl.com.)
a. Describe the trend seen in these data. Are prices increasing or decreasing over time? b. Compare the difference in ticket face value from one year to the next. What patterns do you notice? c. Predict the face value of a ticket for the 60th Super Bowl.
1.2 Functions and Function Notation
Function Notation • y = f(x) • Input (independent variable) • Output (dependent variable)
Functions • A relation is a function if each input value has exactly one output value
Determining Functions • Determine if the relation is a function • (3, 2), (4, 2), (5, 2) • (1, 2), (-1, 3), (1, 7)
Vertical Line Test • Use the vertical line test to determine whether each graph represents a function
1.3 Functions Represented by Tables and Formulas
Is it a function? • Just verify that each input value corresponds to a single output value.
Slope • Slope = rate of change or = change in y change in x = ∆y or ∆x or = Rise Run
Slope- given points • For points slope = • A positive slope goes up as you read the graph from left to right. (A negative slope goes down as you read the graph from left to right.) • As the absolute value of the slope gets larger, the steepness of the incline increases.
Examples • Calculate the slope between each pair of points • (7, 2) and (4, -3) • (8, 2) and (-8, 6)
Average Rate of Change = Change in function value Change in x value = f(b) – f(a) b – a
Average Rate of Change • Page 75 # 4- Baby Girl’s Average Weight
Average Rate of Change • Page 75 #6- Divorce Rate
Average Rate of Change • Page 79 #16- Exxon Mobile
Interpreting Data • Page 81 #20-U.S. Home Sales
Functions of several variables • Sometimes functions depend on more than one variable. • A pay as you go service is as follows: • Phone bill = airtime + text messages + picture messaging • M = .25a + .05t + .25p, where M is measured in dollars. M = M(a, t, p) • airtime = 25 cents per minute • text messages = 5 cents each • picture messaging = 25 cents each • Explain what M(300,15,8) means and find its value.
Borrowing money • If you borrow P dollars at a monthly interest rate of r (as a decimal) and want to pay off the loan in t months, then the monthly payment M(P, r, t) in dollars is calculated using P = amount borrowed r = monthly interest rate, as a decimal t = number of months M = monthly payment
Examples • What does M(6000, .035, 60) mean? • Find the monthly payment. • Suppose we borrow $5600 with a monthly interest rate of .825% and want to pay the loan off in 4 years.
Example • Page 81 #21-22
Solving Equations • Temperature Problems • Page 83 #33-36
Example • Page 86 #47-48
1.4 Functions Represented by Graphs
Two-Variable Data • Ordered Pair • Domain • Range
Domain and Range • Domain- the input values • In an (x, y) situation, these are the “x” values. • The domain is the set of values that are plugged into a function. • When it is limited to values that make sense in the real world it is called the practical domain. • Range- the output values • In an (x, y) situation, these are the “y” values. • The range is the set of solutions we get from plugging the domain values into a function. • When it is limited to values that make sense in the real world it is called the practical domain.
State the Domain and the Range • (2, 3), (-3, 7), (8,3)
Gathering Data from graphs • Page 102 #1-6
Example • Page 103 #16 Cell Phone Subscribers
Examples • Page 104-105 #18-22