Download
1 / 27
270 likes | 358 Views
Explore various assessment methods for environmental values, preferences, and attitudes. Learn about survey issues, respondent types, and analysis techniques. Discover insights from a USDA Forest Service survey on conservation values and behaviors.

E N D
Assessing Public Environmental ValuesSurvey Methods Terry C. Daniel Department of Psychology and School of Natural Resources University of Arizona EPA/SAB C-VPEES April 12, 2005
Preference-based Values Brown, 1984 Held Values “...enduring conceptions of the preferable” Assigned Values “Relative importance or ‘worth’ of a particular object in a particular context”
“Traditional” Model Held Values Assigned Value Perception Environmental Conditions Expressed Preferences
Values and Expressed Preferences Verbal description Traditional view Verbal response Verbal label choice Held Values Preferences Environment Data / graphics w- t - p Rating Photo Clicks & joy sticks Virtual reality
“Radical” Model CONTEXT Held Values Assigned Value Perception/Affect Expressed Preferences Environmental Conditions
Socio-psychological assessments Essentially parallel to economic “stated preference” methods Preferences (judgments) expressed as choices, rankings or ratings—not w-t-p $ Value metrics include importance, liking, preference, acceptance (rarely dollars) Under-informed, undeliberated, irrational public response to policies/outcomes Relative, multidimensional and contextual
Survey Method Issues Target Specific actions, outcomes or general policies Means, ends, equity issues, institutional Constituencies General public, local communities, “stakeholders” Acting for self, household, nation, humanity Representations Verbal (descriptions, labels), graphic, multi-media, direct/on-site
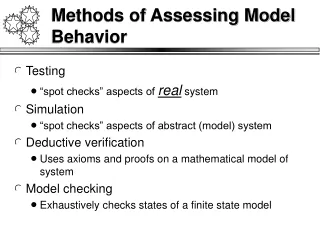
Survey Method Issues 2 Contact Mail, telephone, face-to-face (intercept, home, work) Expressions Preferences, knowledge, beliefs, intensions, attitudes, acceptance Open and/or closed (choices, ratings, allocations) Analysis Factor analysis, multiple-regression, causal models Items => factors (conceptual attributes) Respondents => types (dispositions/biases)
Survey Methods Multi-item survey Distinct verbal statements Closed responses (ratings) Mail, telephone, face-to-face, internet Conjoint Multi-dimensional scenarios (designed) Verbal descriptions/stories Choice and/or rating responses
Survey Methods 2 Perceptual Survey Visual or multi-media representations Conjoint or part of conjoint Closed responses Mail, face-to-face, internet Behavior Observation Traces, diaries, registrations, monitoring (cameras, step pads, etc), direct observation “Revealed preferences”
Multi-item Verbal Survey USDA Forest Service GPRA, Strategic Plan (Shields et al 2002) Telephone survey (n = 7,000+) Values, Objectives, Beliefs & Attitudes 30 items each (overlapping) Each respondent gets subset 5-point rating scales (agree, importance, favor)
Theory of Planned Behavior Rational model Environmental Conditions Beliefs Attitudes Intentions Behavior Social Norms Control
Values 2. Natural resources must be preserved even if people must do without some products. Strongly Strongly disagree 1 2 3 4 5 agree 15. Forests have a right to exist for their own sake, regardless of human concerns and uses. 19. The most important role for the public lands is providing jobs and income for local people.
Objectives 5. Developing new paved roads on forests and grasslands for access for cars and recreational vehicles. Not at all Very important 1 2 3 4 5 important 9. Protecting ecosystems and wildlife habitats. 26. Making management decisions concerning the use of forests and grasslands at the local level rather than at the national level.
Beliefs 5. Developing new paved roads on forests and grasslands for access for cars and recreational vehicles. Strongly Strongly disagree 1 2 3 4 5 agree 8. Preserving the natural resources of forests and grasslands through such policies as no timber harvesting or no mining. 25. Allowing for diverse uses of forests and grasslands such as grazing, recreation, and wildlife habitat.
Attitudes 5. Developing new paved roads on forests and grasslands for access for cars and recreational vehicles. Very Very unfavorable 1 2 3 4 5 favorable 9. Protecting ecosystems and wildlife habitats. 22. Informing the public on the economic value received by developing our natural resources.
Results Demographics East vs West x Metro vs non-metro Familiarity with USFS “Factual questions” (FS sets hunting regulations) Mean rating per VOBA item Factors (composed item-response patterns) Socially Responsible Individual Values 4.16 out of 5.0 (5.0 = biocentric) Socially Responsible Management Values 2.94 out of 5.0 (5.0 = develop/consume)
Conclusions Re: preservation/conservation: “ … important objectives for the public are the preservation of natural resources through policies that restrict commodity uses, protection of ecosystems and wildlife habitat, and preservation of the ability to enjoy a “wilderness” experience. A somewhat important objective is the preservation of local cultural uses.
Conjoint Example USDA Forest Service Wildfire risk management (Kneeshaw et al 2004; University cooperative research) Forests near Denver, Seattle, Los Angeles 3 different fire histories Direct contact (2706) => mail survey (1288) 3 policies (suppress, control, let-burn) Rate Acceptability (7-points, -3 to 0 to +3)
Conjoint Scenarios • Five attributes (dimensions), 2 levels each • Origin of fire (lightning vs. humans-unintentional • Impact on air quality (none vs. poor air quality) • Risk of private property damage (low vs. high) • Forest recovery (quick vs. many years) • Recreation Impact (remain open vs. closed) • Fractional Factorial Design • Main effects tests only • => 8 Scenarios • Regression coefficients for each dimension
Conjoint Scenarios • Least Accepted Scenario (let-burn policy) • Human-caused fire • Poor air quality • High risk of private property damage • Many years for forest to recover • Recreation areas closed for the season • Most Accepted Scenario (let-burn policy) • Lightening-caused fire • No affect on air quality • Low risk of private property damage • Rapid recovery of forest • Recreation areas remain open
Conjoint Results Acceptance of Let-burn Policy %Attribute of Fire 16 Origin of fire 18 Impact on air quality 26 Risk of private property damage 23 Forest recovery 16 Recreation Impact
Perceptual Survey Example University research—USFS sponsored Northwest Forest Plan (spotted owl) 57 nominal interest groups in NW span preservation to production (Ribe 2002) Direct contact, 1120 respondents, in groups Verbal questions re: policy attitudes 115 color slides ranging from fresh large clear-cuts to pristine forest
Verbal/Attitude Component I believe the northern spotted owl is not threatened with extinction. Strongly Strongly disagree 1 2 3 4 5 agree I believe the northern spotted owl should be saved even at a high economic cost. • Cluster analysis to yield 3 distinct, coherent groups: • Productionists • Unaligned • Protectionists
Perceptual Component • Independent groups ( random assignment) • Scenic Beauty (11 point scale) • -5 (very ugly) to +5 (very beautiful) • Acceptability (as National Forest condition) • -5 (very unacceptable) to +5 (very acceptable) • Apply knowledge & sensibilities re: NF management
Perceptual Results All Respondents (& each group) +5 Scenic beauty Mean Rating Acceptability In the spirit of the results -3 115 Forest Scenes (ordered by mean rating)
Perceptual Results Acceptability: comparison +5 Productionists Mean Rating Unaligned Protectionists In the spirit of the results -5 115 Forest Scenes (ordered by mean rating)