Download

1 / 35
360 likes | 478 Views
Rough Set based Decision Tree for Identifying Vulnerable and Food Insecure Households. Rajni Jain 1 , S. Minz 2 and P. Adhiguru 1 1 Sr. Scientist, NCAP, Pusa, New Delhi 2 Associate Professor, Jawaharlal Nehru University. Outline. Problem Knowledge Discovery Process Data Mining

E N D
Rough Set based Decision Tree for Identifying Vulnerable and Food Insecure Households Rajni Jain1, S. Minz2 and P. Adhiguru1 1Sr. Scientist, NCAP, Pusa, New Delhi 2Associate Professor, Jawaharlal Nehru University
Outline • Problem • Knowledge Discovery Process • Data Mining • Classification Task of Data Mining • Methodology: RDT • Dataset for this Study • Classifier Model • Evaluation
Problem of Food Security • Most often, available Funds are scarce • Need to target the Food security program to most vulnerable group. • Exhaustive surveys exclusively for this purpose will be very costly and time consuming. • Need to learn simple concepts to facilitate identification of target beneficiaries people on the basis of morphological characteristics.
Pre-processed Data Preprocessing Selection Target Data Data Transformation Knowledge Discovery in Dataset • Selection phase defines KDD problem by focusing on a subset of data attributes or data samples on which KDD is to be performed. • Preprocessing care to be taken not to induce any unwanted bias. They include removing noise and missing data handling • Transformations may be combining attributes or discretizing continuous attributes • In Data Mining step many different learning and modeling algorithms are potential candidates Tranformed Data Data Mining Interpretation Knowledge Patterns
Data Mining Tasks • Classification • Decision Tree • Decision Rule • Summarization • Association rules • Characteristic rules
Classification Step I Training Data Rules/Tree/Formula Classification Algorithm Step II Estimate the predictive accuracy of the model. If acceptable Step III Step III Classification Rules Label the class New Data
Data • Training Data • The data used for developing the model • Test Data • The data used to estimate the evaluation parameter of the model • New Data • Condition attributes known but decision attribute is not known
Basis of Classification Algorithms • Rough Sets • Decision tree Learning • Statistics • Neural Network • Genetic Algorithms None of the method is suitable for all types of domain
Methodology: Machine Learning • Rough Sets • Decision Tree induction • Rough set based Decision Tree induction (RDT) • Two phases • RS for dominant attributes selection • J4.8 for decision tree induction
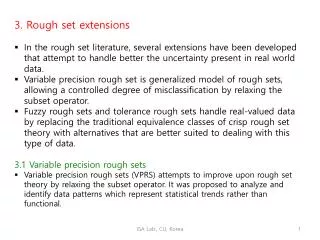
Rough Sets • 1980, Prof. Z. Pawlak, A Polish Mathematician • Indiscernible- similar Objects (say Patients, households etc.) • Indiscernibility Relation
Indiscernibility Relation - contd.. Flu Patients U/IND(H)={{1,4,6}{2,3,5}} U/IND(F)={{1,2,3,6},{4,5}}
Lower and Upper Approximation Let the Bigger Square represent the domain of the universe Small Squares represent the partitions of the universe for a given set of attributes P. All objects in a partition are indiscernible. Oval represents the concept X to be defined P (X)= {13,14,18,19} P(X)={7,8,9,12,13,14,15,17,18,19,20,22,23,24} Coming down in the other square, P={7},P(X)={7}, so crisp set
Important Terms • Reduct: R • A minimum set of attributes that preserve the IND relation. • Decision relative reduct • Core : C • Intersection of all Reducts • Johnson’s method for single efficient reduct computation • GA based algorithm for multiple reducts computation
Data Reduct Computation Algorithm Reduct Remove attributes absent in reduct Reduced Training Data ID3 Algorithm DT Architecture of RDT Model
Decision Tree CHLD y n 0 HAGE Very old young old 1 middle 1 0 LAND 0 1 1 0
Dataset • Source • Primary Survey data of 180 rural households from three villages as a part of the Project by Dr. P. Adhiguru at National Centre for Agricultural Economics and Policy Research (NCAP), India • 3 different production systems from Dharampuri district of Tamilnadu state • Actual food intake was measured by 24 hours recall method. Later corresponding nutrients intake was worked out
Attributes • Attributes are the variables in the dataset that are used to describe the objects • Any attributes is either qualitative or quantitative • In classification problem two types of attributes are considered • Condition attributes - Independent Variables • Class or Decision attributes -Dependent Variable
Food Groups Cereals and Millets Pulses Green leafy vegetables Fruits Milk Fats and oils Roots and Tuber Sugar Nutrients Protein Energy Calcium Iron Vitamin A Vitamin C Energy is used as a proxy for measuring food insecurity of the household
Morphological Attributes HouseHold_Id 1. Land: Whether house has its own land 2. Hedu: Highest education of the head 3. Hage: age of the head in the household 4. Chld: Whether children in the family 5. Flsz: No of members in the family 6. PrWm: Proportion of Women to Family Size 7. Hstd: whether own home stead garden 8. Pear: proportion of earning to family size PCENER: Energy/Capita/day in terms of KCAL 9. Decision: Derived from PCENER
Average Calorie Intake • In Tamil Nadu, Average intake per consumer unit per day in Kcal= 2347 • In Tamil Nadu, Calorie intake of the lowest decile per consumption unit per day in Kcal= 1551 • For All India, Calorie intake of the lowest decile per consumption unit per day in Kcal= 1954 • To identify poorest of the poor, lowest decile average figure was used • If Energy <1500 then decision attribute is labeled 0 means poorest of the poor or vulnerable to food insecurity Else 1 means not vulnerable to food insecurity
Revisiting Problem • Most often, available Funds are scarce • Need to target the Food security program to most vulnerable group. • Exhaustive surveys exclusively for this purpose will be very costly and time consuming. • Need to learn simple concepts to facilitate identification of target beneficiaries people on the basis of morphological characteristics.
Concepts to be Learned from Rural Household Dataset • Decision Tree • A hierarchical structure with root node and sub trees as children • Rules • Tree may be mapped to rules traversing the path from root to leaves
Softwares • Rosetta for Rough set Analysis • Weka for Decision tree induction • C++ programs for interfacing between the two softwares • Excel for Evaluation of the classifiers
Evaluation • Experiment using 10 fold Cross Validation • Accuracy on Test data (A) • Complexity (S) • Number of Rules (Nr) • Number of attributes (Na) • Cumulative Score (CS)
Evaluation of Simplified DT Accuracy =73% Complexity = 43 Number of rules = 9 Num. of attributes = 4 0 :poorest and vulnerable to food insecurity 1: not vulnerable to food insecurity
DT(DRJP) - Nutrition Data Accuracy=73% Complexity=43 Attributes=4 Rules=9 CHLD y n 0 HAGE <40 >51 [41,51) 40 1 1 0 FLSIZE <4 >4 4 1 1 PEAR <45 >45 [45,54) 1 1 0
Benefits • Cost Effective • Timely • Simple to understand and implement • No scope for personal Bias
Constraints • Development or model building requires expertise • Lack of synergy among disciplines • Adequate sample of data • Region specific • Mindset towards conventional and traditional techniques
References • Adhiguru, P. and C. Ramasamy 2003. Agricultural-based Interventions for Sustainable Nutritional Security. Policy Paper 17. NCAP, New Delhi, India. • Han, J. and M. Kamber 2001. Data Mining: Concepts and Techniques. MK • Hand, D., Mannila, H. and P. Smyth 2001. Principles of Data Mining. PHI. • Minz S. and R. Jain 2003. Rough Set based Decision Tree Model for classification, In Proc of 5th Intl. Conference, DaWak 03, LNCS 2737. • Minz, S. and R. Jain 2005. Refining decision tree classifiers using rough set tools. International Journal of Hybrid Intelligent Systems, 2(2):133-147. • Pawlak, Z. 2001. Drawing Conclusions from Data-The Rough Set Way. IJIS 16: 3-11. • Polkowski, L. and A. Skowron 2001. Rough Sets in Knowledge Discovery 1 and 2, Heidelberg, Germany: Physica-Verlag. • Quinlan, J. R. 1993. C4.5: Programs for Machine Learning. Morgan Kauffman. • Rosetta, Rough set toolkit at http://www.idi.ntnu.no/~aleks/ rosetta/. • Witten, I. H. and E. Frank 2000. Data Mining: Practical Machine Learning Tools and Techniques with Java Implementations, MK • Wroblewski, J. 1998. Genetic algorithms in decomposition and classification problems. In: Polkowski, L. and Skowron, A., Rough Sets in Knowledge Discovery 1 and 2, Heidelberg, Germany: Physica-Verlag 472-492. • Ziarko, W. 1993. Variable precision rough set model, Journal of Computer and System Sciences 46: 39-59.