Download
1 / 3
30 likes | 157 Views
Lesplanning economie. Binnenkomst Intro Vragen huiswerk Uitleg docent over tabellen en grafieken. Zelfstandig werken, met radio?? Afsluiting van de les. Lokaal verlaten. Tabel. Een verzameling gegevens in rijen en kolommen. Aantal verkochte ijsjes in 2008. De titel. Een rij.

E N D
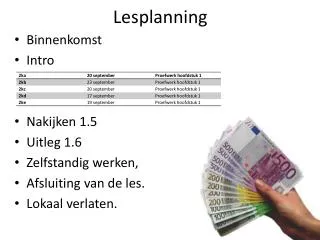
Lesplanning economie • Binnenkomst • Intro • Vragen huiswerk • Uitleg docent over tabellen en grafieken. • Zelfstandig werken, met radio?? • Afsluiting van de les. • Lokaal verlaten.
Tabel Een verzameling gegevens in rijen en kolommen Aantal verkochte ijsjes in 2008 De titel Een rij Een rij Een rij MND= Maand GR= grote ijsjes NOR= normale ijsjes KL= kleine ijsjes Kolom Kolom Kolom Kolom Kolom Kolom Kolom Kolom Kolom Kolom Kolom Kolom Een titel één kolom of meerdere kolommen (van boven naar beneden) één rij of meerdere rijen (van links naar rechts) Een tabel heeft altijd:
Verschillende soorten grafieken Staafdiagram wordt gebruikt om getallen te vergelijken. Cirkeldiagram wordt gebruikt om verhoudingen in procenten weer te geven Lijngrafiek wordt gebruikt om ontwikkelingen in tijd te laten zien.