Download
1 / 56
560 likes | 635 Views
Integration of monitoring efforts in the Chesapeake Bay area for assessing 303(d) impairment decisions under the Clean Water Act. The study explores comparability of sampling methods, indicators, and assessment consistency for freshwater streams and estuarine waters.

E N D
Decision Process for Identification of Estuarine Benthic Impairments in Chesapeake Bay, USA R. J. Llansó*, J. H. Vølstad Versar, Inc., Columbia, Maryland and D. M. Dauer Old Dominion University, Norfolk, Virginia *llansorob@versar.com
Context • States of Maryland and Virginia share the Chesapeake Bay and its tributaries • Need to integrate monitoring and assessment efforts for reporting 303(d) impairment decisions under Clean Water Act
Context • States of Maryland and Virginia share the Chesapeake Bay and its tributaries • Need to integrate monitoring and assessment efforts for reporting 303(d) impairment decisions under Clean Water Act • Integration underway for both • Freshwater streams • Chesapeake Bay estuarine waters
Context • Integration issues include • Comparability of sampling methods • Comparability of indicators of condition (e.g., indices of biotic integrity) • Consistency in overall assessments and designation of impaired waters on 303(d) list
Context Freshwater streams • Maryland has biocriteria (based on Maryland Biological Stream Survey) supporting 303d listings • Maryland and Virginia have different indicators, but comparability study is underway
Context Freshwater streams • Maryland has biocriteria (based on Maryland Biological Stream Survey) supporting 303d listings • Maryland and Virginia have different indicators, but comparability study is underway Chesapeake Bay • Same sampling methods and indicator used by both states • Need consistent method for impairment decisions • Today’s presentation
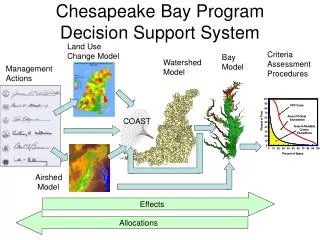
Survey of Condition (Status) Framework for application of B-IBI to the States’ water quality inventories 303(d) Lists Chesapeake Bay Benthic Monitoring Program Restoration Goals Probability Survey Design Benthic Index of Biotic Integrity
Scoring System Benthic Index of Biotic Integrity1 • Multi-metric, habitat-specific index of benthic community condition • Selection of metrics and the values for scoring metrics developed separately for each of seven benthic habitat types in Chesapeake Bay 1Weisberg et al. 1997, Estuaries 20:149-158 1Alden et al. 2002, Environmetrics 13:473-498
Objectives • Develop a procedure for 303(d) impairment decisions based on the B-IBI • Produce an assessment of Chesapeake Bay segments
Alternative approachesfor 303(d) impairment decisions* • Weighted mean approach • Comparisons of cumulative frequency distributions and proportions *using B-IBI scores
Weighted mean approach Weighted Estimates *SE of the weighted mean Example provided by Florence Faulk, US EPA ORD
Weighted mean approach • One-sided t-test, the difference in weighted means divided • by the pooled standard error Example provided by Florence Faulk, US EPA ORD
Cumulative frequency distribution approach H0: Ps = Pref HA: Ps > Pref H0: Ps – Pref > 0.25
Reference frequency distribution comparison among habitats Habitat Class Habitat Class Kolmogorov-Smirnov 2-sided test, X = p<0.05
Which method to use? Cumulative frequency distributions • Not appropriate to pool reference distributions across habitats if the distributions differ
Which method to use? Cumulative frequency distributions • Not appropriate to pool reference distributions across habitats if the distributions differ • Tests based on exact binomial distributions such as Fisher’s exact test not valid for stratified data
Which method to use? Cumulative frequency distributions • Not appropriate to pool reference distributions across habitats if the distributions differ • Tests based on exact binomial distributions such as Fisher’s exact test not valid for stratified data Weighted means • Parametric test problematic for small sample size
Which method to use? Cumulative frequency distributions • Not appropriate to pool reference distributions across habitats if the distributions differ • Tests based on exact binomial distributions such as Fisher’s exact test not valid for stratified data Weighted means • Parametric test problematic for small sample size • Weights based on estimated proportion of each habitat
Which method to use? Cumulative frequency distributions • Not appropriate to pool reference distributions across habitats if the distributions differ • Tests based on exact binomial distributions such as Fisher’s exact test not valid for stratified data Weighted means • Parametric test problematic for small sample size • Weights based on estimated proportion of each habitat • Does not measure areal extent of degradation
Frequency distribution approach using a stratified Wilcoxon rank sum test • Test is robust even when small and unbalanced stratified data sets are used • Can control for Type I and Type II errors • Implemented with StatXact
Reference data set • 243 Chesapeake Bay B-IBI development samples1 1Weisberg et al. 1997, Estuaries 20:149-158 1Alden et al. 2002, Environmetrics 13:473-498
Assessment data set • Chesapeake Bay long-term benthic monitoring program 1998-2002 random samples: • Maryland, 750 • Virginia, 500 • Elizabeth River, 275 • 90 segments (including Virginia sub-segmentation)
Segmentation • Assessments produced for each of 90 Chesapeake Bay Program segments and sub-segments containing benthic data
Segmentation • Assessments produced for each of 90 Chesapeake Bay Program segments and sub-segments containing benthic data • Segments are Chesapeake Bay regions having similar salinity and hydrographic characteristics
Segmentation • Assessments produced for each of 90 Chesapeake Bay Program segments and sub-segments containing benthic data • Segments are Chesapeake Bay regions having similar salinity and hydrographic characteristics • In Virginia, segments were sub-divided into smaller units (sub-segments) to separate tributaries with no observed violations of water quality standards
Standardized classifications of B-IBI scores across habitats • Maximum possible number of B-IBI scores differ by habitat • B-IBI scores were classified into ordered response categories (‘condition categories’)
Comparing B-IBI scores from segments and reference distributions • Segment and reference scores represent two independent ordered multinomial distributions • Test if the two populations have the same underlying multinomial distribution of B-IBI scores by condition category
Hypothesis test • Stratified Wilcoxon rank sum test • Question: Does segment have lower B-IBI scores than reference? • One-sided Test: H0: Equal multinomial distributions H1: Shift in location toward lower B-IBI responses in segment than in reference
Type I and Type II errors • Critical alpha level of 1% will be applied to test for impairment • Only segments where power is >= 90% and p<0.01 will be listed • Minimum sample size for assessment of segment is n >= 10 (same as for freshwater streams)
York River polyhaline Results of assessment • 26 of 90 Chesapeake Bay segments were considered degraded based on the B-IBI and identified as impaired under Section 303(d) of the Clean Water Act
Map of impaired segments Gunpowder River Patapsco River Chester River Magothy River Maryland mainstem Choptank River Patuxent River Potomac River Nanticoke River Tangier Sound Rappahannock River Pocomoke Sound York River Virginia mainstem James River Elizabeth River
Segment CBP7PHa (Virginia mainstem) • Listing of this segment as impaired is problematic, 80% of all B-IBI scores in the segment >= 3.0 • Shift in distribution for pooled (un-stratified) data was 0.33 B-IBI units
Limitations of current approach • Stratified Wilcoxon rank sum test may be too sensitive (detects significant differences for small shifts)
Limitations of current approach • Stratified Wilcoxon rank sum test may be too sensitive (detects significant differences for small shifts) • It is not possible to estimate the magnitude of the shift in location (e.g., with a Hodges-Lehman confidence interval) for stratified data
Limitations of current approach • Stratified Wilcoxon rank sum test may be too sensitive (detects significant differences for small shifts) • It is not possible to estimate the magnitude of the shift in location (e.g., with a Hodges-Lehman confidence interval) for stratified data • For stratified data, it is not possible to evaluate power for a range of sample sizes
Limitations of current approach • Stratified Wilcoxon rank sum test may be too sensitive (detects significant differences for small shifts) • It is not possible to estimate the magnitude of the shift in location (e.g., with a Hodges-Lehman confidence interval) for stratified data • For stratified data, it is not possible to evaluate power for a range of sample sizes • Reference sites are “best of the best”, and may not be representative of typical distribution of scores for good condition
How is this approach used by the States to evaluate aquatic life use support?
Data sufficient? YES Score sample Test segment
Data sufficient? Is segment degraded for B-IBI? Is segment impaired for DO numeric criteria? YES Score sample Test segment YES
Data sufficient? Is segment degraded for B-IBI? Is segment impaired for DO numeric criteria? YES Score sample Test segment YES YES Aquatic life fails Cause: DO B-IBI corroborative Develop TMDL to correct low DO DO corrected
Data sufficient? Is segment degraded for B-IBI? Is segment impaired for DO numeric criteria? Other stressors identified? YES Score sample Test segment YES YES NO Aquatic life fails Cause: DO B-IBI corroborative Evaluate B-IBI for other stressors Develop TMDL to correct low DO DO corrected
Data sufficient? Is segment degraded for B-IBI? Is segment impaired for DO numeric criteria? Other stressors identified? YES Score sample Test segment YES YES NO Aquatic life fails Cause: DO B-IBI corroborative Evaluate B-IBI for other stressors Develop TMDL to correct low DO YES DO corrected Aquatic life fails Cause: Pollutants B-IBI corroborative Develop TMDL to correct pollutants Pollutants corrected
Data sufficient? Is segment degraded for B-IBI? Is segment impaired for DO numeric criteria? Other stressors identified? Aquatic life fails Cause: Pollution Unknown source YES Score sample Test segment YES YES NO Aquatic life fails Cause: DO B-IBI corroborative Evaluate B-IBI for other stressors Develop TMDL to correct low DO YES NO DO corrected Aquatic life fails Cause: Pollutants B-IBI corroborative Develop TMDL to correct pollutants No TMDL required Pollutants corrected
Data sufficient? Is segment degraded for B-IBI? Is segment impaired for DO numeric criteria? Does segment meet WQ criteria? Other stressors identified? Aquatic life fails Cause: Pollution Unknown source YES Score sample Test segment YES NO YES NO Aquatic life fails Cause: DO B-IBI corroborative Evaluate B-IBI for other stressors Develop TMDL to correct low DO YES NO DO corrected Aquatic life fails Cause: Pollutants B-IBI corroborative Develop TMDL to correct pollutants No TMDL required Pollutants corrected
Data sufficient? Is segment degraded for B-IBI? Is segment impaired for DO numeric criteria? Does segment meet WQ criteria? Aquatic life supported Other stressors identified? Aquatic life fails Cause: Pollution Unknown source YES Score sample Test segment YES NO YES NO Aquatic life fails Cause: DO B-IBI corroborative Evaluate B-IBI for other stressors YES Develop TMDL to correct low DO YES NO DO corrected Aquatic life fails Cause: Pollutants B-IBI corroborative Develop TMDL to correct pollutants No TMDL required Pollutants corrected
Data sufficient? Is segment degraded for B-IBI? Is segment impaired for DO numeric criteria? Does segment meet WQ criteria? Aquatic life fails Cause: DO, etc. Aquatic life supported Other stressors identified? Aquatic life fails Cause: Pollution Unknown source YES Score sample Test segment YES NO YES NO Aquatic life fails Cause: DO B-IBI corroborative NO Evaluate B-IBI for other stressors YES Develop TMDL to correct low DO YES NO DO corrected Aquatic life fails Cause: Pollutants B-IBI corroborative Develop TMDL to correct pollutants No TMDL required Pollutants corrected
Data sufficient? Is segment degraded for B-IBI? Is segment impaired for DO numeric criteria? Does segment meet WQ criteria? Aquatic life supported Aquatic life fails Cause: DO, etc. Aquatic life supported Other stressors identified? Aquatic life fails Cause: Pollution Unknown source YES Score sample Test segment YES NO ? Insufficient data YES NO Aquatic life fails Cause: DO B-IBI corroborative NO Evaluate B-IBI for other stressors YES Develop TMDL to correct low DO YES NO DO corrected Aquatic life fails Cause: Pollutants B-IBI corroborative Develop TMDL to correct pollutants No TMDL required Pollutants corrected