Download
1 / 32
320 likes | 454 Views
Investigation on the phenology of Caesalpinia spinosa trees ("Tara") in a Peruvian botanical garden from 2005-2010, exploring the impact of radiation changes and climate on flowering and fruiting cycles.

E N D
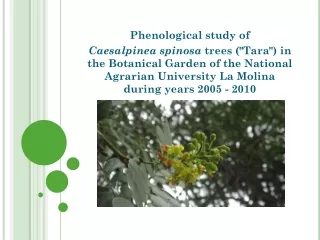
Phenological study of Caesalpinea spinosa trees ("Tara") in the Botanical Garden of the National Agrarian University La Molina during years 2005 - 2010
Participants • Title: Phenological study of Caesalpineaspinosatrees ("Tara") in the Botanical Garden of the National Agrarian University La Molina during years 2005 – 2010. • Students: MaríamercedesAntezana, Cynthia Cerna, Rogelio Campos, Raquel Mori, José Rivas, Gustavo de la Cruz • Collaborators: Oscar Cevallos, Axel Farfán, Diego Márquez, Orlando Zegarra, Heather Franklland • Teacher: Claudia Caro • National Agrarian University La Molina • Special thanks to Professor of Botany Aldo Ceroni • Perú
Inspired! • Inspired by phenology protocols of The GLOBE Program, we decided to analyze changes in the phenology of a peruvian native tree. • Tara is one of the most important resources for us because it has medicinal and cultural value • The determination of phenology cycles is very important to identify indicators of climate change.
RESEARCH QUESTION • Does radiation change influence the phenological trends of Caesalpinea spinosa?
Area of thestudy • The area of study was in the botancial garden of Octavio Velarde Núñez of the National Agrarian University of La Molina, located in Lima, Peru. It has an area of 2 hectares (12º06’ S.; 76º57’ O.), an altitde of 243.7 msnm and in accordance with Holdridge (1960), an earth zone of subtropical dry deserta (dd-S). The average annual temperature is 20º C, the average relative humidity is 84%,and the annual precipitation is y la 11.9 mm ( according to data from the Meterological Observatory, Alexander von Humboldt, UNALM).
Methodology • Consideringthatwe do nothaveenough GLOBE data aboutphenology in ouruniversity, weusedoldphenological data gatheredfromourbotanicalgarden • Wedecidedto use theold data toanalyzetrends of phenologicalcycles and take new data withthe GLOBE Protocolsduringthisyear. • Fructification and flowering of treeswerecalculatedbyconsideringthepercentage of total area of thetreeswithfruitsorflowersalongtheyear • Radiation data from 2005 to 2010 wasanalyzedtostablish a relationshipbetweenthisinformation and phenological data • In ourresearchweconsidered data of fructification and flowering of tara treesfrom 2005 to 2010
Data collection • The phenology data collection is performed by observing the external changes that the plant presents. • In the case of flowering, when the flowers are fully open. - In the fructification, the mature fruits are the ones which present the red color. - In both cases, to determine the percent we observe the crown of the tree. - The data collection is every 15 days.
Phenology Tables(2005-2010) Fructification -Flowering
2005 : Constantflowering in June and July, with more in September • 2006 : Constantflowering in July, August, and September. • 2007 : Constantflowering in AugusttoNovember • 2008 : Constantflowering in Julyto June, withevidence in September • 2009 : Withthefirsttwoindividuals, constant in June. • 2010 : ConstantfloweringfromOctobertoNovember.
Radiation Trend (2005-2010)
Discussion • According the Fig.1 in 2005, fructification is higher in the first months of year, declining in the second part of year • The percentage of fructification is low in 2007, peaking at year end, pattern that is repeated in years 2009 and 2010 • Flowering is comun in the second part of year • Radiation raised in its percentage during last years • Radiation could have influenced in the change of fructification pattern
En base a las estaciones del hemisferio sur General Conclussions • Summer (end of December- Febuary): Radiationis IP withthefruitifacation. In summary, whentheradiationincreases, thereislessfruitorwhentheradiationdecreases, theamount of fruitincreases. • Fall(end of March – end of June): Radiationis DP withthe fructificación. In summary, whentheradiationincreases, thefrutificatioinincreasesorwhentheradiationdecreases, thereislessfruit. • Winter (end of June –end of September) : Radiationis DP withthefruitificaction. Radiación. In summary, whentheradiationincreases, thereis more fruitorwhentheradiationdecreases, thereislessfruit. • Spring (end of september –end of December.): Radiationis IP withthefruitificaction. In summary, whenthetheradiationincreases, thereislessfruitorwhentheradiationdecreases, theamount of fruitincreases. .
Data of 2007 show that fruiting in individuals 176, 262 and 357* have a clear pattern. *However individual 357 seems to possess an abnormal behavior in the spring.
Data of 2008 show that fruiting in individuals 176, 262 and 357* have a clear pattern. *However individual 357 seems to possess an abnormal behavior in summer
Relacionando Tara y radiación anómala. More Conclussions • In July 2008 we observed the highest incidence of radiation which generated a significant increase in fructification. • Individual 357 appears to have different pattern during certain periods of time. • The largest fruiting year corresponding to the summer season (fruiting max.) Was 2008 and the lowest fruiting was 2009.
Ampliación de conclusión In July 2008 is observed the highest incidence of radiation compared to other years for this month, and fulfilling relationship that tara has in winter this presents a considerable increase in the fructificación.
Ampliación de conclusión 357 The individual appears to behave differently during certain periods of time. These are put into evidence during the spring of 2007, mainly in the month of October, and during the summer of 2008, mainly in January
Ampliación de conclusión The largest fruiting year corresponding to the summer season (fruiting max.) it was in 2008 and the lowest fruiting was in 2009. Based on these data, particularly focusing on 2009, we could say that: as the Tara unfold throughout the year this would generate variants marked in maximum fruiting
Recomendations GLOBE protocols should include protocols to measure fructification and flowering pattern in plants, these are very important items. Consider soil quality in the analysis. Take in account water disponibility in the growing of taras