Download
1 / 27
270 likes | 360 Views
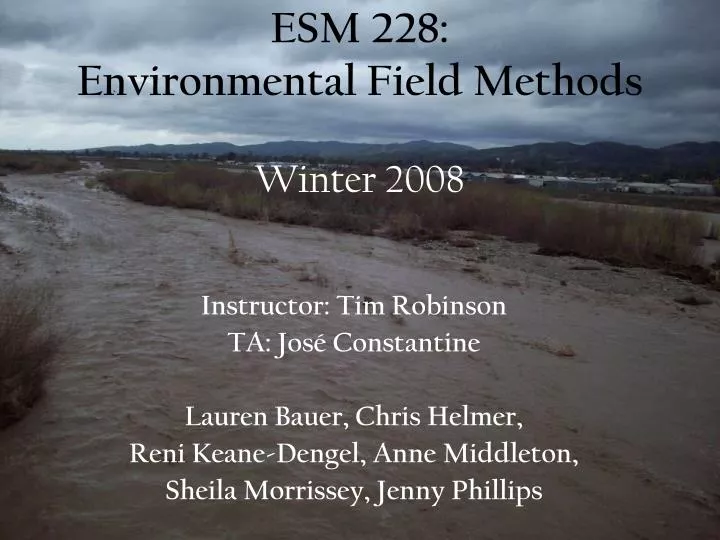
ESM 228: Environmental Field Methods Winter 2008. Instructor: Tim Robinson TA: Jos é Constantine Lauren Bauer, Chris Helmer, Reni Keane-Dengel, Anne Middleton, Sheila Morrissey, Jenny Phillips. The fun we had all quarter….

E N D
ESM 228: Environmental Field MethodsWinter 2008 Instructor: Tim Robinson TA: José Constantine Lauren Bauer, Chris Helmer, Reni Keane-Dengel, Anne Middleton, Sheila Morrissey, Jenny Phillips
The fun we had all quarter… • Visited local watersheds (Tecolote Creek, Bell Canyon, Carpentaria Creek, San Jose Creek, Santa Clara River, Ventura River, Santa Ynez River) • Conducted Field Measurements • Water Quality Parameters (DO, Temp, Conductivity, Nutrients, Flow) • Surveyed Stream Characteristics and Fish Barriers • Evaluated Steelhead Fish Passage • Macro Invertebrates and Periphyton Analysis
Watershed Characterization Drainage Area 5.72 mi2 Tecolote Creek Drainage Area 6.11 mi2 Bell Canyon Creek
Stream Gaging USGS Stream Gages Flow Meters HEC-RAS Rating Curves Pressure Transducers
Used to: Generate a channel profile Determine stream stage for a given flow Key input variable: Manning’s n Limitation: Treats stream bed as a static condition HEC-RAS(Hydrologic Engineering Center River Analysis System)
Determine/calculate flow Are specific to each stream Can change over time (particularly during high flows) Rating Curves
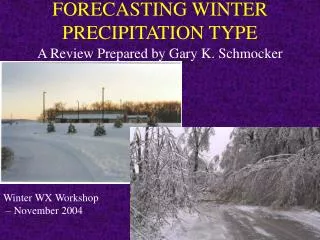
Storm Hydrographs Both watersheds are highly responsive to significant precipitation events
Nutrient and Pathogen Testing • Nutrient testing was preformed using two methods • Profile Sampling; grab samples • Storm Sampling; time series • Pathogen testing was preformed at profile sampling locations
Nutrient and Pathogen Testing • Profile Sampling • Nutrient and pathogen samples were taken from locations throughout each watershed to capture runoff from various land uses. • Chaparral • Agriculture • Residential
Nutrient Storm Sampling During these two storms the flux of nitrate from Tecolote was more than 2x the flux from Bell Canyon
Benthic Macroinvertebrates • Benthic macroinvertebrates are small aquatic organisms found in the bottom area of a water body • Very important part of the aquatic food chain • They are often used as indicators of watershed health
Benthic Macroinvertebrates • Many differing types including: • Ephemeroptera (mayflies) • Plecoptera (stoneflies) • Tricoptera (caddisflies) • Diptera (aquatic flies) • Odonata (dragon and damsel flies) • Coleopteran (aquatic beetles) • Etc www.umass.edu/tei/mwwp/Images/petribugs.gif (Source: Cachuma Conservation Release Board, 2008)
Benthic Macroinvertebrates • Sampling benthic macroinvertebrates allows for the creation of an IBI to determine watershed health. • Measures of species richness, species composition, tolerance/intolerance, and functional feeding groups included in IBI. • Sampling follows Cal Fish and Game guidelines for specific location (NorCal, SoCal) www.fairfaxcounty.gov/... /streams/assessment.htm (Source: Cachuma Conservation Release Board, 2008)
Benthic Macroinvertebrates • Simple analysis preformed in Hilton Creek, Tecolote Creek, Zaca Lake, and a small stream below Zaca Lake • Tecolote Creek impaired compared to Hilton Creek • Highest diversity in Hilton Creek, lowest diversity in Zaca Lake
Fish Passage Adapted from Fish Passage Evaluation at Stream Crossings, CA DFG
Fish Passage A. Velocity too great B. Flow too low C. No resting pool below current D. Jump too high www.umass.edu/tei/mwwp/Images/petribugs.gif
Characteristics of Fish-Friendly Crossings • Crossing width as wide as the active channel • Culvert passes 100yr storm flow at <100% of culvert height • Bottom buried • Natural bed material • Smooth water transition • No obvious turbulence • No excessive scour • Stable conditions up and downstream
Fish Barriers: San José Creek Yeah, Jenny. There’s no way a steelhead could make that in low flow conditions… Wow Sheila, that seems like a big jump for a fish! Whatever, Sheila. You hate fish…
Figure 11. Land use in Bell Canyon (right side) and Tecolote Canyon (left side). Photo source: Google Earth.
T < 21 C, DO > 80% saturation Photo from Santa Barbara Auduban Society, by Craig Fusaro
Thank You for Attending Questions? Comments?