Download
1 / 28
280 likes | 395 Views
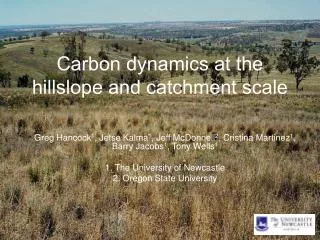
Carbon dynamics at the hillslope and catchment scale. Greg Hancock 1 , Jetse Kalma 1 , Jeff McDonnell 2 , Cristina Martinez 1 , Barry Jacobs 1 , Tony Wells 1 1. The University of Newcastle 2. Oregon State University. Background.

E N D
Carbon dynamics at the hillslope and catchment scale Greg Hancock1, Jetse Kalma1, Jeff McDonnell2, Cristina Martinez1, Barry Jacobs1, Tony Wells1 1. The University of Newcastle 2. Oregon State University
Background • Terrestrial carbon fluxes account for more than half of the carbon transferred between the atmosphere and the earth’s surface • Terrestrial ecosystems represent a critical element of the carbon interchange system • A lack of understanding of the carbon dynamics at the hillslope, catchment and regional scales represents a large source of uncertainty
Agricultural scientists understand carbon dynamics at the point to paddock scale • Speculative about what happens on the hillslope to catchment scale • We know little about how soils and land management affect carbon sequestration at the hillslope and catchment scale
What’s driving catchment soil carbon dynamics? • Textural properties? • Soil moisture, soil temperature? • Vegetation? • Hillslope/catchment hydrology/geomorphology?
Problem of scale At what scale do we need to examine the hillslope and catchmentto quantify and model soil carbon? • DEM grid size of 5m, 10m, ……….250m??? • Vegetation, soil moisture, soil temperature quantification at 5m DEM…. ???????
What’s been done? • Studies concentrated on forested tropical and subtropical regions or in cool temperate landscapes with anthropogenic influence • Australia has received much less attention • No reported attempt to examine the spatial and temporal scaling properties or to scale up data to larger catchments
Case study – Tin Camp Creek Transect 2 Transect 1 Extensive catchment analysis -rainfall/runoff plots -hydrology and erosion model calibration -DEM scale analysis -soil erosion assessment by 137Cs -soil carbon assessment • Location- Arnhem Land, NT • - monsoonal tropics • - no European disturbance • geologically similar to the ERA • Ranger uranium mine
Results- position on hillslope and soil carbon Transect 1 Transect 2 No relationship with soil carbon and hillslope position!
Results- soil carbon and soil erosion Transect 1 Transect 2 No relationship between soil carbon and soil erosion!
Results - hillslope profile and soil texture Transect 1 Transect 2 No relationship with hillslope position and soil texture!
Results - soil carbon with soil textural properties Transect 1 Transect 2 Weak relationship with soil carbon and texture!
What’s driving catchment soil carbon dynamics? • Textural properties? • Soil moisture, soil temperature? • Vegetation? • Hillslope/catchment hydrology/geomorphology? • What scale?
Project: Carbon dynamics on the hillslope and catchment scale
The Goulburn catchment • Use existing equipment (Scaling and Assimilation of Soil Moisture and Streamflow-SASMAS) within the 7000 km2 Goulburn catchment • Mixed grazing and cropping region located 200 km west of Newcastle • 26 monitoring sites (soil • moisture, temp) • stream gauges • 4 climate stations
Project aim • The identification of spatial and temporal patterns within carbon dynamics at the hillslope, subcatchment and catchment scales • Model and predict the distribution (temporal and spatial) of catchment soil carbon
Project requirements • Existing network (SASMAS) of ground based weather, soil moisture and temperature and stream gauges • Complemented with additional stream gauges to quantify Dissolved Organic Carbon, as well as ground based vegetation and soil carbon quantification at each of the field sites • To be done at three scales • Hillslope • Small catchment (Stanley), second sandstone catchment • Goulburn catchment
Remote sensing • Never enough ground based data • Can we use remote sensing to extrapolate ground based data (veg., soil moisture and temp.) over the wider region?
Catchment scale Digital elevation models provide a framework for catchment examination What grid scale do we use? -25m (commercial) -250m (free) -3-arc second (90m) NASA (free)
25m 50m 100m 250m 90m
Digital elevation model creation • Do we need to create our own DEM using differential GPS (time consuming) or LIDAR? • LIDAR offers great potential • Eco-Dimona -Scanning lidar altimeter • -0.1m vertical, 1m horizontal • We believe that a 10m DEM the minimum
Remote sensing of vegetation, soil temperature and moisture Remote sensing used to extrapolate both soil moisture and biomass levels observed at the subcatchment and catchment scales to the larger region • NDVI (biomass) data from LANDSAT 5 or 7, • Soil moisture (interpreted) from GMS and NOAA-AVHRR • Eco-Dimona aircraft - Thermal infrared imager (1m resolution at 500ft) - Tri-spectral scanner (NDVI) (1m resolution at 500ft) - PLMR soil moisture Large scale Small scale
Calibration and validation • Calibration of NVDI data by comparing the remotely sensed data with on-the-ground sampling of the surface vegetation cover • Validation of soil moisture and soil temperature obtained with microwave and infrared sensors mounted on aircraft and satellite platforms over a range of scales
What we can provide to the NAFE and what we need from the NAFE
What we can provide from ground based measurement Soil carbon, biomass, temperature, moisture, textural data - 26 SASMAS sites (7000 km2 Goulburn) - 2 small catchments (750 ha Stanley + one other) - hillslope (Stanley + one other) Soil erosion/sediment transport data for 2 small catchments (hillslope and stream) Water quality data for 2 small catchments
NAFE requirements High resolution data (Eco-Dimona aircraft) -Thermal infrared imager -Tri-spectral scanner (NDVI) -PLMR (soil moisture) for the Stanley (basalt) catchment and for a second (yet to determined) sandstone catchment within the study region
Conclusion • The calibration of remotely sensed data on the smaller subcatchment together with the sparse data collected at SASMAS monitoring site allows us to make predictions about the impact of biomass changes on carbon dynamics • Remotely sensed vegetation data can be coupled with SASMAS soil moisture, soil temperature, rainfall, climate and streamflow data in combination with NDVI/biomass data and the DEM to model hillslope/catchment carbon dynamics