Essential Measurement and Scientific Method Concepts in Science Education
This resource provides a comprehensive overview of fundamental measurement concepts and the scientific method essential for scientific inquiry. It covers key definitions related to graph types, unit conversions, and experimental processes, including hypothesis formulation and data analysis. Interspersed with practical examples, it facilitates understanding of important scientific principles, such as mass, volume, and constants. Ideal for students and educators, this guide serves as a foundational tool for enhancing scientific literacy and skills in measurement and analysis.

Essential Measurement and Scientific Method Concepts in Science Education
E N D
Presentation Transcript
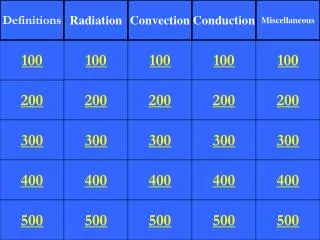
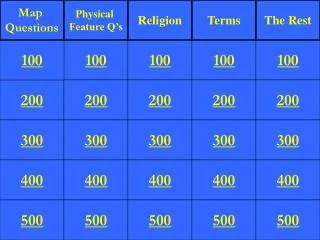
Measure- ment Graphing Scientific Method Definitions Miscellanious 100 100 100 100 100 200 200 200 200 200 300 300 300 300 300 400 400 400 400 400 500 500 500 500 500
The label on a bottle of Pepsi indicates the bottle contains 895 mL of soft drink. How many liters of Pepsi are in the bottle?
A beaker contains 0.48 L of acetic acid. What is the volume of this liquid in milliliters?
What is the number of adults that do not use a vehicle as their method of transportation?
Determine the number of grams of sugar that will dissolve in 100 grams of water at 80oC
In this step the scientist records observations by making charts and graphs
What step do you return to if your conclusion does not support your hypothesis?
In an experiment to determine whether the popping of popcorn is affected b the temperature at which it is stored, counting the popped kernels is an example of ? Conclustion Control Observation hypothesis
An explanation of how and why a natural phenomenon behaves the way it does
Carrie did a study to compare the amount of matter in different types of vegetables. What is Carrie measuring?
April performed an experiment that involved various liquids. In the experiment, she had to determine how much space was occupied by each liquid. What was April trying to determine?
Lincoln is measuring the dimensions of his office. If he measures the distance from one end of a wall to the other, what is he measuring?
The students used correct lab practice when handling samples of pond water. Which practice is NOT an example of correct lab practice? Washing hands before and after each lab session Wearing disposable gloves Discarding samples down the drain Disinfecting the lab countertop before and after each lab session