Download
1 / 17
170 likes | 289 Views
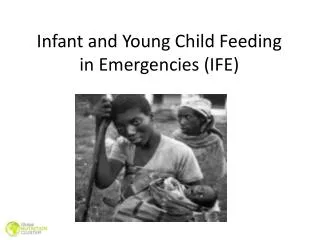
Characterising very early diet exposures: development of a complementary feeding index. Rebecca K Golley PhD APD. Research Fellow Public Health Group Sansom Institute for Health Research University of South Australia, Adelaide. Acknowledgements.

E N D
Characterising very early diet exposures: development of a complementary feeding index Rebecca K Golley PhD APD Research Fellow Public Health Group Sansom Institute for Health Research University of South Australia, Adelaide
Acknowledgements Lisa G Smithers2, Murthy N Mittinty2, Laima Brazionis2, Pauline Emmett3, Karen Campbell4, Sarah McNaughton4, Kate Northstone3, John W Lynch2,3 1University of South Australia, 2University of Adelaide, Australia, 3University of Bristol, England, 4Deakin University, Australia Funding support: RKG is supported by the National Health and Medical Research Council of Australia.
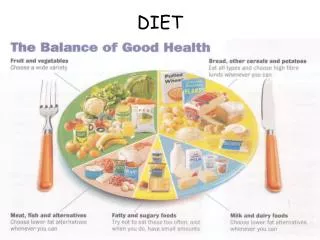
Why the Complementary Feeding Period? • Nutritionally sensitive period • Breastfeeding duration • Age of introduction of solids • Type, amount and composition of food • Supply of energy and nutrients • Establishment of lifelong dietary behaviours • Food habits • Taste and texture preferences • Implications for later diet, health and development
What’s the Challenge? • Three studies ‘diet quality’ <12 mo age Smithers et al Nutr Reviews 2011 • Nutrient adequacy, Diet diversity • Child Feeding Index • Complementary feeding guidelines • Sufficient nutritious food for growth, development & health (amount, quality, variety, moderation) • Developmentally appropriate (timing, texture) • ‘How’ to feed (responsive feeding, persistence)
Study Aim • To development an index to characterise quality of the complementary feeding period • adherence to complementary feeding guidelines • developed country context • address (some) methodological challenges • To examine the face validity of the Complementary Feeding Utility Index (CFUI) • Food and nutrient intake • sociodemographic characteristics • Dietary patterns in childhood
Summary of Diet Index Construction Selection of index components Quantification of component scores Summing of component scores Adapted Kourlabaet al 2009 TOTAL SCORE ‘Diet quality’
CFUI: 14 components Breastfeeding (months) 0 1 2 3 4 5 6 7 8 9 10 11 12 0 5 10 Energy dense nutrient poor foods (types) 0 1 2 3 4 5 6 0 5 10 Fed on demand (categorical ) N S Y 0 5 10
Quantification of component scores: Conversion to Probabilities Variety of Protein foods = # children having 1 to 3 types protein foods - # having 1 or 2 or 3 types # children having 1 to 3 types protein foods = 9747 - # children having 1 type protein foods i.e. 4735 9747 = 0.51
Quantification of component scores: Theoretical Derived Probabilities
How to derive a total score? • Each component has score of 0 to 1 • Sum or mean: various pathways=same score • Inverse Euclidian norm: how each component score varies from guideline adherence
Mean CFUI score = 0.48±0.1 N=6065 6 mo
Association with energy-adjusted nutrient intake Nutrient intake at 8 months of age for Children In Focus sub-sample (n=989)
Socio-demographic factors • Higher Complementary Feeding Utility Index scores were associated with • older maternal age • higher maternal education level • Healthy maternal weight status. • Higher Complementary Feeding Utility Index scores were not associated with • Number of siblings
Association with Dietary Patterns at 3 y N=6065 Adjusted models; dietary pattern scores, child, maternal and family socio-demographics
Conclusions • The Complementary Feeding Utility Index • reflects adherence to early feeding guidelines • has face validity as a composite measure of early diet quality • scores were associated with food and nutrient intake largely in the expected direction • Methodological challenges addressed • components that are unit free • Scoring range based on observed/ theoretical preferences • Contribution of components to total score • Next steps • Predictive validity: association with child health and development outcomes
Questions? Thank you!