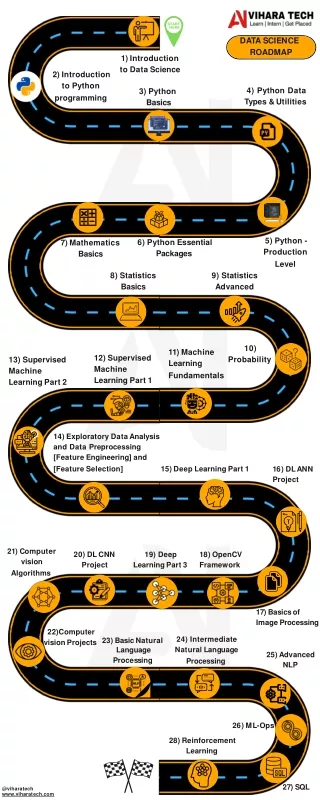
Data Analysis Road Map
Vihara Tech Data Analysis Roadmap<br>The Vihara Tech Data Analysis Roadmap is a structured learning path designed to help students and professionals build strong data analysis skills from the ground up. This roadmap provides a step-by-step guide to mastering data analysis, covering essential concepts, tools, and real-world applications.<br><br>Key Highlights of the Roadmap:<br>Introduction to Data Analysis u2013 Understanding the importance of data and its role in decision-making.<br>Excel & Spreadsheets u2013 Learning data manipulation, visualization, and basic statistical functions using Excel.<br>SQL for Data Analys


Data Analysis Road Map
E N D
Presentation Transcript
3.5 MONTHS COURSE ROADMAP Introduction to Data analysis DAY-1 TO Data Analysis with real-world Examples Applications using Data Analysis Applications using PowerBI Applications using Tableau Applications using Web Scrapping SQL and Databases Python Basics Data types Variables Operators Print Precision and Field width Python Installation and Running Installation and Running Jupyter Notebook .py file from terminal Google Collab String List Tuple Sets Dictionary Day 15 DAY 15 DAY 16 PYTHON BASIC EXAM’S AND MOCK’S directenglish viharatech
Python Advanced DAY-17 TO Error / Exception Handling File Handling JSON module OS Module Pickle Module Datetime Module CopyModule Oopsconcept Class Object Constructor Inheritance Polymorphisam Abstraction Excapsulation Python Production Level What is Process? What is Multiprocessing? What is Multithreading? Start Join Kill Terminate DAY 33 ASSESSMENTS DAY 34-35 PYTHON ADVANCED EXAM’S AND MOCK’S Python Libraries Numpy Pandas Data Visualization Library: Matplotlib Seaborn Statistics Advanced Descriptive Statistics Measure of Central Tendency Measure of Dispersion Outliers DAY-36 TO directenglish viharatech
Covariance Correlation Testing Hypothesis testing Mean Median Mode etc. Web Scrapping ASSESSMENTS DAY 55 Python request Modules html content DAY 56 PYTHON LIBRARIES EXAM’S AND MOCK’S Excel Basics Basic Excel Functions Cell Formatting Data Entry and Editing Formulas Cell References Formatting Numbers Data Sorting and Filtering Charts and Graphs Data Analysis Tools Conditional Formatting Excel Advanced Formulas and Functions math formulas LOOKUP INDEX-MATCH PivotTables (Creating Filtering Grouping) Charts and Graphs Column chart Line chart Pie chart etc Conditional Formatting DAY-57 TO directenglish viharatech
Data Validation Named Ranges Excel Tables Functions for Text Manipulation LEFT RIGHT CONCATENATE etc Functions for Date and Time DATE TODAY MONTH etc Data Import and Export Tableau Tableau Introduction Tableau Installation What is Data Source What is sheet What is DashBoard What is Story telling Tableau visualizations Tableau alignments Tableau Parameters Tableau sets Tableau GroupBy Include Exclude Bar Chart Line Chart Pie Chart Map Scatter Plot Histogram Gantt Chart Bubble Chart Heat Map Tree Map Box Plot Area Chart Dual-Axis Chart DAY 64 DAY-65 TO +2 Assignments directenglish viharatech
Waterfall Chart Highlight Table Packed Bubbles Word Cloud Funnel Chart Ascending order Descending order Transform Publish Data Reports DAY 75 DAY 76 TABLEAU EXAM’S AND MOCK’S Power BI PowerBI Introduction PowerBI Installations Data Explanation Power BI Desktop Visualizations Bar chart Line chart Pie chart Area chart Scatter plot Bubble chart Treemap Funnel Card Geographic map Filled map Line chart Area chart Histogram Donut chat Model View Explanation DAX Formulas Power Query DAY-77 TO +2 Assignments DAY 87 directenglish viharatech
DAY 88 POWER BI EXAM’S AND MOCK’S SQL SELECT statement FROM clause WHERE clause JOINs INNER JOIN LEFT JOIN RIGHT JOIN FULL JOIN GROUP BY clause HAVING clause ORDER BY clause Aggregate functions (SUM AVG COUNT MIN MAX) DAY-89 TO Subqueries (Nested queries) UNION and UNION ALL Views (CREATE VIEW ALTER VIEW DROP VIEW) Indexes (CREATE INDEX DROP INDEX) Transactions BEGIN TRANSACTION COMMIT ROLLBACK Constraints PRIMARY KEY FOREIGN KEY UNIQUE CHECK Data manipulation INSERT UPDATE DELETE +2 Assignments DAY 99 DAY 100 POWER BI EXAM’S AND MOCK’S EXAM DAY 101 directenglish viharatech