Download

1 / 12
120 likes | 215 Views
Explore how demographic factors influence Asian students' academic success in Los Angeles public high schools. Analyze API scores, peer pressure, family income, parental education, and population density, providing insights into the educational landscape.

E N D
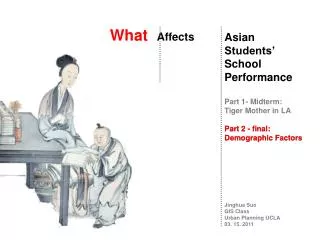
What Affects Asian Students’ School Performance Part 1- Midterm: Tiger Mother in LA Part 2 - final: Demographic Factors Part 2 - final: Demographic Factors JinghuaSuo GIS Class Urban Planning UCLA 03. 15. 2011
Los Angeles Public High Schools (HS ) 646 800 881 200 400 600 800 1000 API: Achievement Performance Index Source: CA Department of Education http://www.cde.ca.gov/ta/ac/ap/
71HS Where Asian Students Significant 646 646 600 800 1000 Asian Minimum 713 LA Mean 646 Source: CA Department of Education http://www.cde.ca.gov/ta/ac/ap/
General Performance of Asian Students 600 800 1000 7Asian HS < 800 Only 7 HS Asian API < 800(CA Goal) 7HS<800 64HS>800 Source: CA Department of Education http://www.cde.ca.gov/ta/ac/ap/
1 Mile Service Area around the 8 HS 1 3 8 2 > 800 4 < 800 5 200 400 600 800 7 6 1.La Mirada HS 2.Richard Gahr HS 3.Mayfair HS 4.Lakewood HS 5 Milikan HS 6 Wilson HS 7 PolyTechnic HS 8 Jordan HS Low API HS Hi API HS Source: Map Share + ERSI
what are affecting these Asian Students ? 1. La Mirada 3. Mayfair 1LA Mirada 3Mayfair 8Jordan 2Richard 2. Richard Gahr 4. lakewood 4 Lake Wood 5Milikan 5 Milikan Senior 7 Polytechnic 7 PolyTechnic 6 Wilson 6 Wilson 8 Jordan
Compare Median Family Income 1 3 8 2 4 5 7 $20,000 40,000 60,000 80,000 100,000 6 Income Matters Slightly Source: Social Explorer www.socialexplorer.com/pub/home/home.aspx
Compare Educational Level 1 3 8 2 4 5 7 5 10 15 20 25 30% 6 Parents’ Educational Level Matters Slightly Source: Social Explorer www.socialexplorer.com/pub/home/home.aspx
Compare Asian Population Density 1 3 8 2 4 5 7 10 20 30 40 50 60 70 80% 6 Peer Pressure Matters Less Asian Pop Less Peer Pressure Less API Score Source: Social Explorer www.socialexplorer.com/pub/home/home.aspx
Compare Divorced & Separated Rate 1 3 8 2 4 5 7 5 10 15 20 25 30 35 40% 6 Two Parents Matters Single Parent Lower API Score %Separate/Divorce Source: Social Explorer www.socialexplorer.com/pub/home/home.aspx
Model Image ,Metadata & Skills Model: Clip : The four Low API Schools Serve areas & LA Census Tracts Metadata: LAHIgnSchl.Shapefile Includes all of the 450 Public High Schools in LA, With school names and addresses. Skills: Modeling, Metadata, Service area (Net work analysis ), Original data, Extract data-service area, Charts / images, Geocoding, Clip, Database, Graduated Symbol, Attribute Selection,
Thank You! Nice Holiday!