Optimal Procedure Development for Interstellar Urea Search with CARMA Arrays
120 likes | 226 Views
Explore detailed methodology for detecting interstellar urea using CARMA arrays, ensuring accurate frequency measurements, baseline subtraction, and flux extraction. Investigate urea energy levels, spectra line fits, and rotational temperature analysis.

Optimal Procedure Development for Interstellar Urea Search with CARMA Arrays
E N D
Presentation Transcript
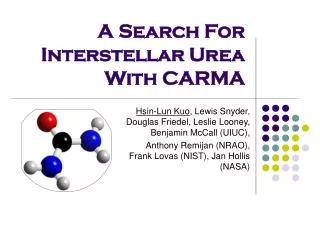
A Search For Interstellar Urea With CARMA Hsin-Lun Kuo, Lewis Snyder, Douglas Friedel, Leslie Looney, Benjamin McCall (UIUC), Anthony Remijan (NRAO), Frank Lovas (NIST), Jan Hollis (NASA)
Motivation • Urea (NH2)2CO has measured and calculated laboratory frequencies good to a few kHz. • In preparation of CARMA search for protonated methanol (frequencies measured by McCall group), we wish to develop procedures with trustworthy calibrator fluxes, proper baseline subtraction, and self calibration to extract weak emission lines from CARMA data.
CARMA (Combined Array for Research in Millimeter-wave Astronomy) • Owens Valley Radio Observatory (OVRO) -- 10.4 m X6 Berkeley-Illinois-Maryland Association (BIMA) -- 6.1 m X9 • 105 baselines • Angular resolution about 0.3", 0.8", 2", 5", or 10" at 100 GHz in A, B, C, D, and E configuration • Operates at 3 mm (85-116 GHz) and 1 mm (215-270 GHz)
Line Fits & Spectral Analysis • Beam averaged total number density (cross-correlation array) (See Appendix in Snyder et al. 2005) • Intensity ratio
Temperature Plots • Plot I1v.s. Trot • All plots consistent with Trot ~ 80 K • Previous BIMA result Trot = 77 K
Conclusion • Rotational temperature Trot ~ 80K • Linewidth ∆v ~ 2.05 km s-1 • Beam-averaged total column density Ntot = 9.75 1014 cm-2 • Proper coupling of source size to the beam size is essential for flux measurements and detection limits; it helps bring out weak signals that are otherwise blended with extended emission.