Download

1 / 41
410 likes | 532 Views
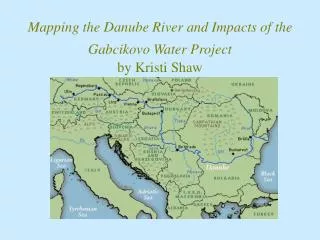
Application of a new technology in the surveying and mapping of Danube River. Temenoujka Bandrova University of Architecture, Civil Engineering and Geodesy, Sofia, Bulgaria bandrova_fgs@uacg.bg. Introduction.

E N D
Application of a new technology in the surveying and mapping of Danube River Temenoujka Bandrova University of Architecture, Civil Engineering andGeodesy, Sofia, Bulgaria bandrova_fgs@uacg.bg
Introduction • The river surveys should be ensure that the waterways are free from obstructions and the channel depth is sufficient for safe shipping. • They carry out hydrographic services for beach surveys – to monitor for both accretion and erosion as well as should be ensure that dredging for restoration is being carried out effectively • Nowadays GPS provides a powerful technology capable of meeting all hydrography requirements in a reliable and sophisticated manner.
Geodetic datum and reference systems • The maps- different reference systems referred to the different ellipsoids different map projections • Height systems: orthometric, normal referred to different levels – Black Sea level, Baltic, Adriatic
Geodetic Datum in Bulgaria Horizontal Datum • For defence purposes we used the 1942 and 1942/83 datum, associated with the Krasovski ellipsoid and the Gauss-Krueger projection – now it is changed with WGS 84 and UTM projection • In the early 70s - a system of planar coordinates in the 4 conic conformal projections. Propose – 1 conic conformal Lambert projection with 2 standard meridians
Geodetic Datum in Bulgaria Vertical datum • From the 1950s the national levelling network has been connected to Romania and recomputed with regard to the Baltic Sea level, Kronstadt tide-gauge. • As normal corrections have been introduced into the elevation values, the difference between the Black Sea and the Baltic systems is not a constant, and varies from 19 to 34 cm
Historical review of the Danube River maps in Bulgaria • The firstmap, 1905-1913,54 sheets Scale 1:10 000 and 1:20 000 • The second map, 1935-1943, Scale 1:10 000 • The third map, 1964-1966,Scale 1:10 000 The planar coordinates of each point have been computed using two Gauss-Krueger projection zones, with central meridians 24° and 27°, respectively.
Surveying experiment • The aim - the surveying and mapping of territory reaches of the river, applying new technologies, in order to establish the preconditions for remedial actions: · Development and application of modern methodology and technology including GPS use for surveying and mapping of the Danube River; · Generation of precise maps of the riverbed from historical and current measurements; · Assessment of the morphological and hydrological situation and its development for planning of remedial actions based on a common view and perception of the major processes.
Surveying experiment Source data • The research of existing data has shown that 6 trigonometric points precisely defined in WGS84 are available. • Topographic maps scaled 1:25000, latest edition, over the right hand side bank of pilot reach area (12 sheets), as well as diagrams of the existing trigonometric and levelling networks. • Accordingly, more than 200 trigonometric and traverse point, and also some 100 levelling benchmarks are situated there. • A few points exist on the terrain.
Surveying experiment Ruse Svishtov Planning considerations • The surveying experiment area has been selected in the reach km 547- km 557, near the town of Svishtov, Bulgaria, and the Romanian Zimnicea. • Bulgarian and Romanian team - Bulgarian hydrographic vessel equipped with echo sounder and related navigation/positioning tools - GPS receivers provided by both teams Sofia
Surveying experiment Planning considerations • To provide geodetic support, pairs of opposite trigonometric points existing on both sides of the river had to be selected. A benchmark had to be built up next to each of the gauges at Svishtov, Zimnicea, Ruse, and Giurgiu. • The distance between the profiles crossing the river was selected to be 250 m, which is equivalent to 40 profiles in the surveying experiment.
Surveying experiment Planning considerations • According to the Bulgarian proposal, a unified reference system and mapping projection had to be introduced by both parties participating in the surveying experiment. • Based on the WGS84 reference frame, available through the EUREF (ETRF89) coordinates of some existing points, System 2000 is offers an appropriate solution.
Surveying experiment Inland measurements • Certain number of control points have positioned in the WGS84/EUREF reference system • Reconnaissance and monumentation have been performed of 15 reference stations and another 5 points throughout the pilot reach, separated by 5 km, as well as of 17 traverse points within the experimental area. • The inland measurements have been completed with a pair of Wild System 200 GPS receivers operating in the static mode.
Surveying experiment Inland measurements • The observations have processed by the SKI software of Leica. • WGS84/EUREF coordinates have been assigned to the reference points, where available and disseminated through the measured baselines to the rest of points in the project. • The transformation is performed by the special software. • Standard transformation errors have been obtained as follows: mx = 11 cm, my = 9 cm, mh = 2 cm.
Surveying experiment Riverbed bottom surveying • Burgas hydrographic vessel furnished with Atlas-Deso echo-sounding and ranging equipment has been used to survey the pilot reach in profiles separated by intervals of 250 m. • The echo sounder output consists of diagrams containing a time-tagged graph of the measured river depths, as well as a calibration graph providing data for the depth of the tranceiving antenna beneath the water surface. The drawing quality allows the value in each data point to be estimated as accurate as 0.10 m
Surveying experiment Riverbed bottom surveying • Each sounding point has been positioned in the WGS84 system using Trimble 4400 and JAVAD GPS receivers, operating in the real-time kinematic mode. • The coordinates of each point, measured by echo sound, is derived using GPS-receivers operating in real-time kinematic mode. The accuracy can be assumed as 10 cm in ground (mean error) and 15cm in height (mean error). • The observations have been acquired at 5 sec rate, and transferred to the roving receiver via radio link. Taking into account the speed of the vessel, 5-10 km/h, that is equivalent to 12-15 m distance between two neighboring data points.
Surveying experiment Processing of echo sounder diagrams The diagrams are manually processed: time-referencing, getting 5-sec depth readings, averaging calibration value, i.e. the depth of the tranceiver, and also recording the distances from the banks at to the endpoints
Surveying experiment Assembling of GPS and echo sounder data • As outlined, there is no electrical synchronization between the GPS receiver and the echo sounder. As the output of both is time tagged, important is only to start them at the same instant, and to reliably identify the later. The same applies to the stop command. • Concluding, the implemented method does not provide reliable coincidence of both series of data, regardless the skills and efforts of the team. Therefore the data assembly has become an important and time-consuming step.
Surveying experiment Accuracy of data and results • Surface definition: the riverbed surface has a certain roughness. In a given scale, it can be defined only with a specific accuracy. The roughness depends mainly on the material of the surface. In addition to this static uncertainty, the dynamical changes have to be taken into account. Thus, the riverbed can be defined for a longer period only with an accuracy of up to half a meter.
Surveying experiment Accuracy of data and results • Distribution of measurements: the region of the riverbed, which is affected by the measurement is very limited: · The measurement profiles are placed approx. every 100 m. · The smallest depth measurements are about 5m, which means, the region from 5m depth to the shore line is not sampled. The river banks above the shore lines are also not sampled, which would be necessary for an analysis of changes. That means, independent of the measurement accuracy, big errors may occur, because large features of the river bed are not sampled.
Surveying experiment Mapping the riverbed bottom • Various products have been derived from these DEMs: Contourline maps, z-codings, profiles, intersection models with similar products. For DEM-calculation the system SCOP1 has been used. • Contourlines are mostly used as a mean for visualization. • DTM calculation: from the discrete measurements a continuous surface is calculated. The apriori errors in height of DEM calculation have been chosen with 30cm.
Surveying experiment Z-codings • Another possibility for visualization are z-codings: the heights of the DEM are grouped into several classes, each of which is assigned a colour. This visualization allows a quick perception of critical areas, e.g. shallow areas, areas with high erosion, etc.
profiles from data set 1999: km557, km556+750m, km556+500m, km556+250m and km556 (from up to down).
Surveying experiment Processing of historical data (maps) The processing of maps can be grouped in three steps: • Digitalisation of the maps: this has been done manually and/or automatically. • Transformation of the maps: each map is in its own co-ordinate system and has to be transformed into a common system. • Calculation of Digital Elevation Models (DEMs) for analysis of the situation. Several images are worked out as results.
Conclusions and recommendations Reference systems • World Geodetic System WGS84, represented in Europe by ETRF89 • In 1992 Bulgaria joined the EUREF network with 7 points, which in the last years were increased up to 15 stations, which have been precisely determined (within 1 cm). • Recently a precise National GPS network of 450 points is building on the territory of Bulgaria
Conclusions and recommendations Reference systems • As to the planar coordinates, a reasonable choice would be the conic conformal projection with parameters fit to the shape and size of the Danube area. Under the name System 2000 the Bulgarian party has recently proposed such set of definitions and parameters. • These activities provide the background to establish and introduce an advanced geodetic system, which to replace the existing classical ones, and to contribute to compatibility within EC and NATO standards in surveying and mapping.
Conclusions and recommendations GPS (GNSS) technology • GPS can be used for this purpose in different mode: DGPS, Real-time kinematic or post-processing kinematic ones. It depends of the accuracy and the local conditions.
Conclusions and recommendations Equipment • Now the river surveyors have a variety of echo-sounding and positioning tools to use to carry out their surveys.Indispensable part of the equipment is also a pair of powerful GPS receivers capable of operating in real time both on-line with the echo sounder, and independently.
Conclusions and recommendations Assembling of GPS and echo sounder data • Тhe implemented method does not provide reliable coincidence of both series of data, regardless of the skills and efforts of the team. Therefore the data assembly has become an important and time-consuming step. • When the diagrams are manually processed, this includes time-referencing, getting 5-sec depth readings, averaging calibration value. Therefore, it is completed taking into account also the GPS timing data automatically stored with the corresponding data point. • It needs to use an automatic synchronization and processing only.
Conclusions and recommendations Important advantage of the GPS positioning • The vessel may not strictly follow the profile line because the method is fully independent from onboard and coastal navigational facilities, and provides three-dimensional spatial coordinates (X, Y, Z) at any time when four and more satellites are “visible”. The profiles are still needed but only for survey planning purposes.
Conclusions and recommendations Map projection • All countries along the Danube should use a uniform coordinate and height systems for all control points, benchmarks and gauges, situated along the river banks and on the islands. The bases of these systems are EUREF. Results such as maps of the Danube River, GIS-applications, etc. have to be prepared in Lambert conic conformal map projection.
Conclusions and recommendations Map projection Conical conformal map projection WGS84 ellipsoid parameters: • a – semi-major axis: • f –flattening,: Projection parameters: • 0– latitude of the standard parallel0– origin of longitudes: • x00 – origin of abscises (northing) • x0 – abscise of the pole; • y0 – origin of ordinates (easting): • K0 -Scale factor along the standard parallel. a = 6378137 m f = 1/298.257222101 0= 46° 0= 19° x00=5096085.9623 m x0 = 11262374.9480 m y0 = 2 115 070.3251 m K0 = 0.9994
1= 43°59’ 59”.884 and 2= 47°58’ 33”.251 The scale factors along these parallels are: K1 = K2 = 1.000 000 • Numerical computation formulae • . • where • m – abscise (northings) of the projection pole, • - auxiliary ellipsoidal parameters • distance of the currentpoint from the projection pole • isometric latitude • - polar angle of the current point
Conclusions and recommendations Advantages of the projection • The Danube flows from the West to the East between the parallels are S = 430andN = 490. • А standard parallel 0 = 460 is assumed and a scale along this parallel К = 0.9994 - two parallels 1 = 440 и 2 = 480 will be drawn in their real length and the scales along the parallels S = 430 and N = 490 will be 1.000743 and 1.000793 respectively. • Inside the area lying between the parallels 1 = 440and 2 = 480 the scale will vary from 0.9994 до 1.0000.
Conclusions and recommendations Аdvantages of thе projection • Outside this area the scale will vary within the limits from 1.0000 до 1.0008. I.e. besides the fact that the projection is not only conformable but it has also small deformations in the lengths. This is extremely important for a GIS or a map since it will give reliable quantitative information. In addition, it is very significant for navigation.
Conclusions and recommendations Аdvantages of thе projection • The coordinate system is uniform for all countries along the Danube and is based on the internationally accepted ellipsoid WGS 84 and the European reference system EUREF. • Making up a common map and comparing the hitherto existing maps of the different countries is extremely difficult and in some cases even impossible. In a word using the old maps is connected with many difficulties.
Conclusions and recommendations Аdvantages of thе projection Remark • Proposals for pan-European map projections. The reference system will be ETRS89 and Ellipsoidal GRS 80 coordinates. • UTM (width of zones 6o, scale factor at central meridians 0.9996, false Easting Yo = 500 000 m) • Lambert conformal conic projection with two standard parallels (35 o N и 65 o N , false Northing Xo= 2 800 000 m, false Easting Yo = 4 000 000 m ) • Lambert azimuthal equal area projection with grid origin 52 o N и 10 o E, and false Northing Xo= 3 210 000 m, false Easting Yo = 4 321 000 m. • None of them is suitable for Danube River.
Conclusions and recommendations Аdvantages of thе projection A uniform special geodetic control network is necessaryfor common programme for monitoring of the geodynamic situation along the stream of the Danube River. Also a uniform GIS and a uniform map are necessary for the Danube Riverand for the bank. The existing charts will therefore in future be transferred to the current equivalent of WGS 84 Datum. It is necessary to provide the electronic chart service from a national hydrographic office with worldwide coverage and an automatic updating service.