Ecodata: Values, sources, precision
Explore the precision and accuracy of data on embodied energy, carbon footprints, and environmental properties in materials production. Learn about tracking carbon emissions, eco-indicators, energy utilization, and recycling practices. Delve into the nuances of different materials like wood, kenaf, coal, and precious metals in terms of energy intensity and sustainability.

Ecodata: Values, sources, precision
E N D
Presentation Transcript
Data Accuracy • Engineering properties are well characterized. • Environmental properties are not. • Embodied energy • Carbon footprint
Embodied Energy • Energy to product a unit of mass of material • ISO 14040 gives guidelines, but they are vague. • How much can we trust the presented values? Studies suggest 10% variance is optimistic.
To what end? • Although the lack of accuracy is a problem, it depends on the ultimate goals. • We can only make conclusions if differences are significant (much more than 10%). • Often we see ranges to account for lack of accuracy (200-240 MJ/kg, e.g.)
Geo-Economic Data • Information about the resource base from which material is draw, and the rate of exploitation. • Annual World Production is the mass of material extracted annually from ores/feedstock • Reserve, as we know, is current economical sources
Ecoproperties: Material Production • The embodied energy (Hm) is the energy committed to create 1kg of usable material. • CO2 footprint is the release of CO2 into the atmosphere - kg of CO2 for each kg of material produced.
Embodied Energy • this is not done by pure thermodynamics, due to inefficiencies in actual processes and scrap waste, and other things • The Input/Output Analysis is used. • The total energy input to the production plant over some period of time is measured; including that already invested in feedstock. • The total output (mass of material) over that same time period is recorded. • The ratio of these two is the MJ/kg Embodied Energy.
Embodied energy accounting • Must include the feedstock and its embodied energy in your calculations to get a robust understanding. • Suppose we want to study bottles of soda. First we figure out the feedstock by looking at the energy entering the plant per hour and dividing by the mass of PET produced per hour.
Tracking Carbon • Carbon tracking is done similar to energy. • Carbon emissions come from transport, energy generation, feedstocks, and fuels. • Usually expressed as kg of CO2 per kg of material
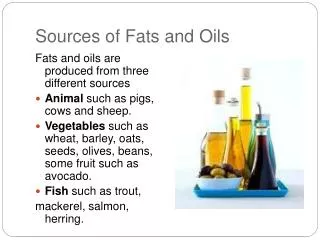
Tracking Carbon • Plants grow by absorbing CO2 and H2O and converting it to cellulose and lignin etc. • Wood sequesters carbon • Some say the carbon footprint of wood is negative (it removes carbon from atmosphere without releasing it)
Coal • Thinking about sequestering, coal is dervied from plant life. The carbon in the coal was once in the atmosphere. • It does not get a negative footprint because we don’t replace it after use. • A credit is only real if it gets replaced.
Kenaf • Kenaf can be grown without fertilizer, and grows fast. It can grow fast enough to convert the carbon used in processes - sometimes over 1 inch per day
Wood • Is wood more like kenaf or coal? • Forests are being removed faster than they are replaced world-wide. • Until stocks are replaced as fast as they are consumed, wood should be viewed more like coal than kenaf.
Data Precision • The mean value of the previous Aluminum chart is 204 MJ/kg. • The standard deviation is 58 MJ/kg (c. 25%) • If we design on allowables, we include several standard deviations. • e.g. Al embodied energy is 100-300 MJ/kg
Eco-Indicators • Attempts are made to combine energy, water, and emissions into a single ECO-INDICATOR value.
EcoProperties • Materials are processed and finished. This adds energy to the product. • Polymers are molded or extruded • Metals are cast, forged, machined • Ceramics are shaped (sintering) • There is energy with each
More steps • We’ve made PET pellets, now we need to make bottles...
Recylcing and End-of-Life • Now that we’ve made bottles, we can still track them. • They go to the bottling factory, get filled, used, and possibly recycled.
Recycling • Often (not always) recycled materials result in reduced embodied energy in a produced object. • This is because some of the embodied energy from first life is retained.
Special cases: Precious metals and electronics • Precious metals used in small quantities, but have a high embodied energy, carbon, and cost. • Generally have exception conductivity, resistance to corrosion and thus make good electronics parts. • Same is true of electronics themselves
Transport • Products are made in cheapest location and then transported to customer • We express energy of transport as energy per ton-km, and CO2 in kg/ton-km
Exploring the data • Bar charts vs Bubble Charts • Bar charts show a value for each item • Range of bar shows range of values • Bubble charts show ranges for a material that have two different properties • Watch for logarithmic axes!
Material Property Charts • Give an overview of physical, mechanical, functional properties in a compact way • Reveal aspects of physical origins of properties • Tool for optimized selection of materials to given design requirements • Allow properties of new materials to be displayed and compared with conventional materials