Download
1 / 53
530 likes | 556 Views
This presentation discusses the different measures used to assess patient safety culture in healthcare providers, including the AHRQ Hospital Survey on Patient Safety Culture, the Safety Attitudes Questionnaire, and the Patient Safety Climate in Healthcare Organizations survey. The presentation also highlights areas of improvement and qualitative observations from these surveys.

E N D
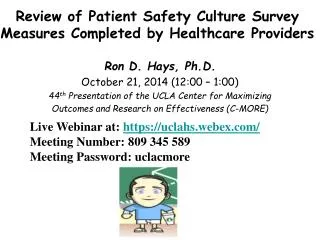
Review of Patient Safety Culture Survey Measures Completed by Healthcare Providers Ron D. Hays, Ph.D. October 21, 2014 (12:00 – 1:00) 44th Presentation of the UCLA Center for Maximizing Outcomes and Research on Effectiveness (C-MORE) Live Webinar at: https://uclahs.webex.com/ Meeting Number: 809 345 589 Meeting Password: uclacmore
CMOREhttp://cmore.med.ucla.edu/index.htm 05/11/2010Robert Kaplan, PhD How Do We Interpret Unexpected Findings From Large Clinical Trials?06/08/2010Brian Mittman, PhD Achieving the Promise of CER: The Role of Implementation Science07/13/2010Benjamin Craig, PhDComparing Health Outcomes in Comparative Effectiveness (CHOICE) Research: Do preferences matter?
Motivation for Today’s Topics • Agency for Healthcare Research and Quality (AHRQ) Safety Culture Conference funded by R13 to: • Jason Etchegaray, Ph.D. • University of Texas-Houston Medical School • Held October 2, 2014
Putting Safety in Context* Advances in medicine have led to positive outcomes: • Most childhood cancers are curable • AIDS is now a chronic disease • Life expectancy has increased 10 years since the 1950s However, sponges are still found inside patients’ bodies after operations. *Note: Slide from Comprehensive Unit-based Safety Program (CUSP) http://www.ahrq.gov/professionals/education/curriculum-tools/cusptoolkit/index.html
Health Care Defects in U.S.* • 7% of patients suffer a medication error2 • On average, every patient admitted to an intensive care unit suffers an adverse event3,4 • 44k—99k die in hospitals/year as the result of medical errors5 • > half a million develop catheter-associated urinary tract infections, resulting in 13,000 deaths/ year6 • Nearly 100k die from health care-associated infections (HAIs)/year and the cost of HAIs is $28 to $33 billion/year7 • 30k—62k deaths from central line-associated blood stream infections/year8
Patient Safety Culture Measures • AHRQ Hospital Survey on Patient Safety Culture (HSOPSC or SOPS) • http://www.ahrq.gov/legacy/qual/patientsafetyculture/hospsurvindex.htm • Safety Attitudes Questionnaire (SAQ) • https://med.uth.edu/chqs/surveys/safety-attitudes-and-safety-climate-questionnaire/ • Patient Safety Climate in Healthcare Organizations (PSCHO) Survey • http://www.midss.org/content/patient-safety-climate-healthcare-organizations-pscho
AHRQ Hospital Survey on Patient Safety Culture (HSOPSC or SOPS) • 42 items measuring 12 domains • Supervisor/manager expectations (k = 4) • Organizational learning/Cont. improve (k = 3) • Teamwork within units (k = 4) • Teamwork across units (k = 4) • Communication openness (k = 3) • Feedback/comm. about error (k = 3) • Non-punitive response to error (k = 3) • Staffing (k = 4) • Management support for safety (k = 3) • Handoffs/transitions (k = 4) • Frequency of events reports (k = 3) • Overall perceptions of patient safety (k = 4)
2012 Comparative Database • 1,128 hospitals • 66% non-teaching • 80% non-government • 567,703 hospital staff respondents • Mean of 503 surveys/hospital • 53% response rate • Respondents • 35% registered nurse, or licensed vocational nurse/licensed practical nurse • 11% technician (e.g., EKG, lab, radiology) • 8% administration/management • 6% attending, resident, physician assistant, or nurse practitioner
Areas in need of Improvement • Non-punitive response to error (44% positive) • Staff feel that their mistakes and event reports are not held against them and that mistakes are not kept in their personal file. • Handoffs and tradeoffs (45% positive) • Important patient care information is transferred across hospital units and during shift changes • Staffing (56% positive) • Enough staff to handle the workload and work hours are appropriate to provide best care.
Safety Attitudes Questionnaire (SAQ) • 30 items measuring 6 domains • Safety climate (k = 7) • Teamwork climate (k = 6) • Perceptions of management (k = 4) • Job satisfaction (k = 5) • Working conditions (k = 4) • Stress recognition (k = 4)
Patient Safety Climate in Healthcare Organizations (PSCHO) Survey • 31 items measuring 7 domains • Senior managers’ engagement (k = 7) • Organizational resources (k = 3) • Overall emphasis on patient safety (k = 3) • Unit safety norms (k = 7) • Unit support/recognition for safety effort (k = 4) • Fear of blame (k = 2) • Fear of shame (k = 5)
Qualitative Observations (HSOPSC) • Response options
Reliability Model Reliability Intraclass Correlation Two-way random Two-way mixed One-way BMS = Between Ratee Mean Square N = n of ratees WMS = Within Mean Square k = n of items or raters JMS = Item or Rater Mean Square EMS = Ratee x Item (Rater) Mean Square
Reliability Formulas Model Reliability Intraclass Correlation Two-way random Two-way mixed One-way BMS = Between Ratee Mean Square N = n of ratees WMS = Within Mean Square k = n of items or raters JMS = Item or Rater Mean Square EMS = Ratee x Item (Rater) Mean Square
Reliability Formulas Model Reliability Intraclass Correlation Two-way random Two-way mixed One-way BMS = Between Ratee Mean Square N = n of ratees WMS = Within Mean Square k = n of items or raters JMS = Item or Rater Mean Square EMS = Ratee x Item (Rater) Mean Square
rwg (i) • 1 – (Sxj2 / sigmaEU2) • Within-group interrater reliability for Xj (Proportion of non-error variance) • Sxj2 = observed variance on Xj • SigmaEU2 = variance on Xj if all judgements were due to random measurement error • Expected error variance based on uniform distribution. • (NCAT2 – 1)/12 • James et al. (1984, J App Psych)
ValidityDoes scale represent what it is supposed to be measuring? • Singer et al. (2009) • Hospitals (91 hospitals, 18,223 respondents) with better safety climate overall had lower relative incidence of patient safety indicators • PSIs recommended by AHRQ Quality Indicators Support Team (see Appendix for list) • 2004 MEDPAR data • Frontline personnel’s (not senior manager’s) perceptions of better safety climate were associated with lower incidence of patient safety indicators
New Directions • Standardized General Population Metric • Category Response Curves • Computer Adaptive Testing • Differential Item Functioning • Linking of Different Measures
T-score Metric • T Score referenced to US Hospitals • Mean = 50 • SD = 10 • T = 50 + (z * 10)
Item Responses and Trait Levels Person 1 Person 2 Person 3 Trait Continuum Item 1 Item 2 Item 3 www.nihpromis.org
PROMIS Physical Functioning vs. “Legacy” Measures 10 20 30 40 50 60 70
Differential Item Functioning (DIF) • Probability of choosing each response category should be the same for those who have the same estimated scale score, regardless of other characteristics • Evaluation of DIF by subgroups
DIF (2-parameter model) Men Women White Slope DIF Location DIF AA I cry when upset I get sad for no reason Higher Score = More Depressive Symptoms
Linking of Difference Patient Safety Culture Measures • Equipercentile linking of scores • Scores associated with equivalent % • X scores and Y scores correspond to same number of SDs above or below the mean • Matches two cumulative distribute functions to each other either via smooth functions or non-parametrically • IRT linking • Map onto logistic scales
Linking Assumptions • Instruments are measuring essentially the same thing (unidimensional) • Scores from the two instruments are highly correlated (> 0.80); compare actual with estimated scores • Subgroup invariance (standardized root mean square deviation)
Etchegaray & Thomas (2012) • R-squared for SAQ teamwork = 54% 0.83 + 0.34* HSOPSteamwork + 0.51* HSOPScommun. • R-squared for SAQ safety = 42% 1.63 + 0.65* HSOPorganizationallearning • Correlations among SAQ and HSOPS • Etchegaray & Thomas (2012) Table 4 • Predominantly unidimensional • 8.2, 1.28 and 0.96 are 1st 3 principal components • If two factors rotated 2nd factor shows common variance among 5 HSOPS scales • Teamwork within, non-punitive, number of events reported, expectations, and staffing
Bibliography DiCuccio, M. H. (2014). The relationship between patient safety culture and patient outcomes: A systematic review. J Patient Saf, epub. Etchegary, J. M., & Thomas, E. J. (2012). Comparing two safety culture surveys: Safety Attitudes Questionnaire and Hospital Survey on Patient Safety. BMJ Qual Sat, 21, 490-498. Morello, R. T. et al. (2013). Strategies for improving patient safety culture in hospitals: A systematic review. BMJ QualSaf, 22, 11-18. Sammer, C. E., Lykens, K., Singh, K. P., Mains, D. A., & Lackan, N. A. (2010). What is patient safety culture? A review of the literature. Journal of Nursing Scholarship, 42, 156-165. Sexton, J. B. et al. (2011). Assessing and improving safety climate in a large cohort of intensive care units. Crit Care Med, 39, 934-939. Sexton, J. B. et al. (2006). The Safety Attitudes Questionnaire: Psychometric properties, benchmarking data, and emerging research. BMC Health Services Research, 6, 44. Singer, S. et al. (2009). Relationship of safety climate and safety performance in hospitals. Health Services Research, 44, 399-421. Singer, S. et al. (2007). Workforce perceptions of hospital safety culture: Development and validation of the Patient Safety Climate in Healthcare Organizations Survey. Health Services Research, 42, 1999-2021 Sorra, J. S., & Dyer, N. (2010). Multilevel psychometric properties of the AHRQ hospital survey on patient safety culture. BMC Health Services Research, 10, 199.
drhays@ucla.edu(310-794-2294). http://gim.med.ucla.edu/FacultyPages/Hays/
Appendix: 12 PSIs in Singer et al. (2009) • Complications of anesthesia • Decubitus ulcer • Inatrogenic pneumothorax • Infection due to medical care • Postoperative hip fracture • Postop hemorrhage or hematoma • Postop physiometabolderangmnt • Postop respiratory failure • Postop PE or DVT • Postop sepsis • Postop wound dehiscence • Accidental puncture/lacertaion
Previous CMORE Talkshttp://cmore.med.ucla.edu/index.htm 05/11/2010Robert Kaplan, PhD How Do We Interpret Unexpected Findings From Large Clinical Trials?06/08/2010Brian Mittman, PhD Achieving the Promise of CER: The Role of Implementation Science07/13/2010Benjamin Craig, PhDComparing Health Outcomes in Comparative Effectiveness (CHOICE) Research: Do preferences matter?
CMORE 08/10/2010Robert Brook, MD, ScDCan We Establish a Business Case for Comparative Effectiveness Research? 09/14/2010Brennan Spiegel, MD MSHS, FACGIntroduction to Cost-Effectiveness Analysis: How to Figure out if the Juice is Worth the Squeeze.10/12/2010Michael Ong, MD, PhD Comparative Effectiveness Research on Reducing Heart Failure Readmissions.
CMORE 11/09/2010TerylNuckols, MDUtilization of care as a criteria for comparative effectiveness research. 12/14/2010Francesco Chiappelli, PhDToward Clinically Relevant Complex Systematic Reviews (CRCSR's), and beyond: Recent Milestones and Remaining Challenges.01/11/2011Ken Wells, MD, MPHCommunity-partnered comparative effectiveness research in mental health.
CMORE 02/08/2011John Adams, PhDPhysician Cost Profiling.03/08/2011Mark Litwin, MD MPHCaring for the Uninsured in California with Prostate Cancer. 04/12/2011Katherine Kahn, MD, PhDApproach to the Evaluation of the Effectiveness of Decision Support Systems for Advanced Imaging Procedures.
CMORE 05/10/2011Patricia Ganz, MDComparative Effectiveness and Studies of Breast Cancer Outcomes and Quality.07/12/2011Lisa Rubenstein, MDQuality Improvement and Implementation Science in the Era of Comparative Effectiveness.08/16/2011Sarah StarksCost and Effectiveness of Full Service Partnerships: Assertive Community Treatment of Severe Mental Illness
CMORE 09/13/2011John Romley, PhDHospital Spending and Inpatient Mortality: Evidence from California.10/18/2011Emmett Keeler, PhDCost effectiveness of lung cancer screening in the NLST.11/08/2011Ian Coulter, PhDOverview and Critique of Comparative Effectiveness Research.
CMORE 12/20/2011Pamela Davidson, PhDImproving Safety through Intervention, Innovation, Policy Analysis, and Workforce Development.01/17/2012Cheryl Damberg, PhDPotential Unintended Consequences in Pay for Performance Programs. 02/21/2012Ron Anderson, PhDThe State of Comparative Effectiveness Research at the National Level
CMORE 03/20/2012Roger Lewis, MD, PhDAdaptive Clinical Trials04/17/2012Dominick Frosch, PhDCommunicating Comparative Effectiveness Research Results to Patients 05/15/2012Kevin Grumbach, MDThe Translational Research Challenge: Improving the Health of the Community.
CMORE 06/19/2012Robin Clarke, MD Incorporating Stakeholders: Examining the Medical Home Through an Adaptation of the Modified Delphi Process. 07/17/2012David Reuben, MDUCLA Alzheimer's and Dementia Care: Comprehensive, coordinated, patient-centered. 08/21/2012Brian Mittman, PhD "Methods Matter": Goals and Content for the First PCORI Methodology Report and Standards.
CMORE 09/18/2012PCORI Discussion Panel on Patient-Engagement (Tim Carey and Paul G. Shekelle)How can we meet or surpass the bar raised by PCORI on stakeholder engagement in our research - from study design to dissemination.10/16/2012Christopher Saigal, MD MPH Improving Decision Making at the Point of Care: Opportunities and Challenges.
CMORE 12/4/12 Douglas Bell, MD PhDValue of Information: A Brief Summary. Lenore Arab, Phd, MSPCORI Update: Board of Governors Recap01/15/2013Wendy Slusser, MD How to Build Stakeholder Engagement into Studies02/19/2013Lenore Arab, PhD MS What PCORI Wants: An Open Discussion of PCORI Reviews, PCORI Reviewers, and PCORI Successes.
CMORE 03/19/2013Mellissa Withers, PhD, MHS Qualitative Research.04/16/2013Bruce Dobkin, MD UCLA Wireless Health Institute can Help Investigators.05/21/2013Alison Hamilton, PhD, Brian Mittman, PhD, and Gail Wyatt, PhDStudying Effectiveness and Implementation of Evidence-Based, Research-Developed Programs in Routine Care Settings: Tradeoffs and Challenges in Study Designs and Methods.