Download
1 / 13
130 likes | 239 Views
Analysis of the 2004 Survey of Safety Net Providers. Christy H. Lemak, PhD Allyson G. Hall, PhD Lilliana L. Bell, MHA March 3, 2006. Introduction. County Health Department Clinics and Community Health Centers (CHC) are designed to meet the needs of the medically underserved

E N D
Analysis of the 2004 Survey of Safety Net Providers Christy H. Lemak, PhD Allyson G. Hall, PhD Lilliana L. Bell, MHA March 3, 2006
Introduction • County Health Department Clinics and Community Health Centers (CHC) are designed to meet the needs of the medically underserved • Play integral role in serving the uninsured
Objective • Assess the infrastructure and capacity of the health care safety net in Florida • Explore the capacity of Community Health Centers (CHCs) to organize into health plans.
Methods • Survey instrument designed at FCMU • Sample included DOH and CHC who are members of the Florida Association of Community Health Centers (FACHC) • Survey items addressed: • organizational challenges • disease management programs • managed care technology • patient access and demographics • continuum of care • Based on similar questionnaire from NY
Organizational Challenges • Obtaining specialty care for patients (87%) • Patient complexity – social and economic issues (66%) • Financial issues (64%) • Overall, CHCs had less challenges than DOHs • All central Florida respondents indicated ‘obtaining specialty care’
Disease Management Programs • 43% of organizations operate a formal disease mgmt. program • Diabetes (27%), asthma (12%), mental health (5%) • More CHCs have programs than DOHs • More than 80% of CHCs have reminder systems for providers to administer screenings, order tests, etc. • Half of central Florida respondents have a program (only for diabetes)
Patient Care Access Tools • Computer Based Systems: • 94% of organizations use computer-based systems for scheduling and verifying Medicaid eligibility • 3% use computer-based systems for tracking ER visits • < 2% use computer-based systems for profiling hospital admissions and ER use by PCPs • CHCs have more comprehensive systems (100% use computers) • All Central Florida respondents have systems in place
Patient Care Access Tools • Access • 72% of organizations accept walk-ins on a limited basis (depending on capacity) • 19% always accept walk-ins • 3% never accept walk-ins • Average of 2,557 appt. slots per week • DOHs more likely to accept walk-ins • Half of central Florida respondents accept walk-ins on a limited basis, and half always accept walk-ins
Patient Care Access Tools • Language • 87% of organizations have patients who prefer language other than English during visits • Spanish (57%),Haitian Creole (8%) • Most frequently, a friend or staff member acts as informal interpreter • 60% of organizations use provider who speaks patient’s language • Also use AT&T language line and trained interpreters
Services for the Uninsured • Organizations with Network/Subcontractor • 87% of organizations have contracts with MediPass • 46% have contracts with a Medicaid HMO • 16% have contracts with Medicare • CHCs more likely to network and/or subcontract • 75% of Central Florida respondents have contractual relationships with MediPass or a Medicaid HMO
Services for the Uninsured • Financial Arrangements and Services for Uninsured Patients • 84% of organizations charge uninsured patients on sliding scale • BUT, 55% provide services without regard to payment of financial arrangements • < 8% require a deposit paid before visit • Most orgs don’t subsidize services to the uninsured
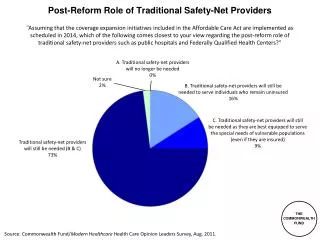
Services for the Uninsured • Local Programs/Activities for Uninsured • 88% of organizations site the health dept. clinic, the Free/Volunteer clinic, and the Community Mental Health Center as the programs which address the uninsured issue • 38% of CHCs and 16% of DOHs indicate a local health plan or benefits plan for uninsured in their area
Services for the Uninsured • Primary Care Services • County Health Departments only • 90% provide on-site primary care • Average of 369 primary medical encounters per week