Download
1 / 36
360 likes | 526 Views
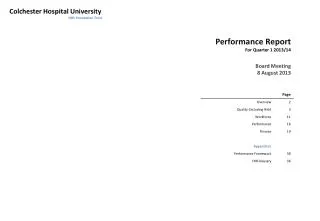
Performance Report For Quarter 1 2013/14 B oard Meeting 8 August 2013. Overview. Quality The HSMR position for April was 84.49 . SHMI (which measures inpatient mortality and deaths up to 30 days after discharge) identifies CHUFT as having a 'higher than expected' mortality ratio.

E N D
Performance ReportFor Quarter 1 2013/14Board Meeting8 August 2013
Overview Quality • The HSMR position for April was 84.49.SHMI (which measures inpatient mortality and deaths up to 30 days after discharge) identifies CHUFT as having a 'higher than expected' mortality ratio. • Clostridium Difficilein Q1 was 7 against a ceiling of 5 (ceiling for 2013/14 is 18). • The overall score for the Net Promoter for Q1 was 77%. • Risk: At the end of Quarter 1 there were a total of 70 live risks held within the Trust section of the Risk Register. There are no outstanding Extreme or High risks to be reviewed on the Risk Register. • Workforce • Monthly turnover was 0.86% contributing to an annual turnover of 9.91% (which is over the 9.5% target). • The monthly figure for sickness absence is 3.22% and the rolling 12 month figure is 3.86%. • Vacancy rates are higher than the Trust 4% target for all staff groups, 6.5% for the Trust. • Performance • The Trust will be reporting a governance rating of Green for Quarter 1. • Although the Trust is above its plan on Clostridium Difficile for the year to date, it does not score adversely because Monitor applies a de-minimus of 12 cases for this indicator. The Trust had 7 cases against a plan of 5for Q1. • Activity: Elective and day case activity is below plan due to the under delivery of planned developments. For day cases this is driven by Urology and T&O. For elective it is largely General surgery and Gastroenterology. • Outpatients are over delivering against the revised plan, mainly in Cardiology. • Non Elective activity is delivering to plan • Finance • The Trust’s EBITDA and overall position were both worse than plan. EBITDA was £1.56m (2.5% margin) and the Trust delivered a deficit of £1.54m against a planned deficit of £1.17m. The Financial Risk Rating (FRR) of 2 meets plan. Liquidity scores a strong 4. • The spend on the capital programme for the year to date is £2.4m against a planned spend of £2.9m for the same period. 2
Quality Quality Exception Report : Q1 Variance in Performance In Q1 there were 7 Clostridium difficilecases against a ceiling of 5. The ceiling for the year is 18. This over-performance is driven by 5 Cases in May, which was particularly high. Outside of May the Trust has been on trajectory. Evidence shows there is no correlation or link between the incidents to date. The Trusts SHMI identifies CHUFT as having a 'higher than expected' mortality ratio. For the period October 2011 to September 2012, the SHMI for Trust was 117.22. Actions To continue to monitor compliance of antibiotic prescribing, hand hygiene, environmental cleanliness. Review deep cleaning programme. An on-going investigation of health records is underway to determine if the cause of the Trust’s SHMI is related to data quality, coding or pathway. CUSUM alerts are being monitored closely, and cases are reviewed as a CUSUM alert is identified. Performance Recovery It is recognised that the target of 18 for the year I very challenging. It is essential that the actions identified are rigorously applied and performance is closely monitored if the required target is to be achieved. 3
Quality – Patient Safety Summary There were 258 falls recorded for Q1. Therefore, there have been 39 (13%) fewer falls recorded compared to the same quarter in 2012/13. There were 3 serious harm falls in Q1. There has not been a serious harm fall since 13th April 2013. The average number of reported hospital acquired grade 2 pressure ulcers each quarter during 2012/13 was 21; for Q1 2013/14 there were 13. Compared to Q1 2012/13, there has been a reduction of 53.6% in the number of grade 2 pressure ulcers and 53.3% fewer grade 3/4 pressure ulcers. Rounding compliance for Q1 has been 93-96%. Significant improvements in audit performance has coincided with a re-launch programme that commenced late last year. The NHS Safety Thermometer audit for Q1 was successfully conducted across the hospital and uploaded to the NHS information Centre in line with CQUIN requirements. 4
Quality – Patient Experience • Summary • ‘At Our Best Everyone Everywhere’ • ‘In Your Shoes’ workshop sessions took place during April 2013. This enabled the Trust to feedback the good work which has taken place over the past year but more importantly, to talk to patients to find out where further improvement is required. The information gathered has been correlated with the ‘In Our Shoes’ session which took place in February. • There will be key engagement with staff around ‘At Our Best’ over the next few months. Following the Keogh review, there's an opportunity to be more supportive towards each other and a chance to extend ‘At Our Best’ so that it's about how we are with each other as well as patients. • The average Meridian score for Q1 was 89%. • The Net Promoter or Friends and Family score during Q1 was 77.1. That places the Trust in the upper quartile of Trusts for this indicator. Compliance with response returns was 23% against a target of 15%. 5
Quality – Infection Control • Summary • The MRSA bacteraemia trajectory remains at 0. MRSA screening compliance is improving (currently 86.9%). The Infection Control Team are visiting inpatient areas to understand why we are failing to regularly screen all patients. • Clostridium difficile in Q1 ; CHUFT 7 against a ceiling of 5 • (ceiling for 2013/14 is 18). As of 30/6/2013, CHUFT were therefore 2 cases above trajectory. We have seen an improvement in nurse-led cleaning, but work needs to continue on antibiotic prescribing. • All cases are recorded as incidents on Datix, a root cause analysis is completed by ward staff, and panel reviews are organised. • Monthly meetings are held with the CCG and the Infection Control Team to review each case. An action log exists for these meetings. • Feedback from the panel review process identifies the cases appear unrelated. Work continues to ensure robust compliance with: • Hand hygiene • Antibiotic prescribing • Environmental cleanliness • A number of new proposals are currently under review; these would increase capacity relating to equipment decontamination and the deep clean programme. 6
Quality – Mortality Summary The HSMR for April 2013 was 84.49. The indicative rebased HSMR position for 2012/13 is approximately 105. Crude relative risk for April was 84.59. SHMI (which measures inpatient mortality and deaths up to 30 days after discharge) identifies CHUFT as having a 'higher than expected' mortality ratio. For the period October 2011 to September 2012, the SHMI for Trust was 117.22. The Patient Safety Committee will be monitoring the negative CUSUM alerts in Dr Foster (diagnosis groups/procedures where Trust performance is significantly worse than the benchmark) and facilitating the investigation of health records to determine if the cause was down to data quality, coding or pathway. Mortality rates followed historic trends for the end of 12/13. April to June figures are lower than previous years and continue the trend from the end of 12/13. 7
Quality - Risks Summary Summary Currently, there are 70 active risks on the Trust Risk Register. There are currently 6 High risks that have been reviewed this month. 8
Workforce Workforce Exception Report : Q1 Variance in Performance At the end Q1, the Trust had a vacancy rate of 6.43% against a target of 4%. Mandatory Training was at 55.6% against a target of 100%. Staff Engagement/advocacy scores put the Trust at or below average for Acute Trusts. (Scores: Engagement 3.61 (UQ 3.9), Advocacy 3.53 (UQ 4)) Actions An international recruitment campaign for nursing and medical staff. Changes to medical rotas and creation of revised resourcing model to deliver OOH care, with a plan for contingency/winter pressure by End September Review of mandatory training offering/simplification and clarity on training for fitness to practice and time allocation Engagement plan prepared for Board and a range of actions underway across leadership, communication, alleviating work pressure and managing performance. We will undertake trust wide survey end Sept to measure progress. Performance Recovery The aim is to have a vacancy level for nurses of 2% by end October and to have offers by October for ‘difficult to fill roles’. To have revised medical rotas and resourcing plan by the end of December By the end of Q3 to have 90% of the revised proposal for mandatory training met By end of Q4 aim for 3rd quartile re Staff Engagement/advocacy subject to full accountability and leadership 11
Workforce – Staff in Post & Turnover Summary The information provided shows the Establishment and Staff in Post figures at the end of Quarter 1 – 2013-2014. Vacancies – The Trust now employees 63 more employees in Jun-13 than it did in Mar-13. A successful overseas recruitment campaign has resulted in 40 additional Band 5 Nurses being recruited in Quarter 1. An additional 30 will be placed in Quarter 2. The trust has also reviewed its acuity staffing levels on the Wards, reviewed the need for maternity backfill to be covered and to replace sisters to enable them to remain super numery. A further international campaign will be undertaken in August and by 1 October, vacancy levels for nursing will be reduced to below 2%. Risks continue around stability of the scientific community due to uncertainty of future roles in TPP. Annual turnover to 30-Jun-2013 was of 9.91% (still below the 10% target rate for 13-14). The Turnover % excludes all Locums & Junior Doctors (Foundation Year 1, 2 and Speciality Registrars)
Workforce – Vacancies Summary The information provided shows the Establishment and Staff in Post figures at the end of Quarter 1 – 2013-2014. By Staff Group - Vacancy % is above Trust target for all Staff Groups. Nursing & Midwifery has reduced from 8% to just over 4% following the Recruitment of Spanish Nurses. Plans are in place to reduce the Nursing target to under 2% by the end of Quarter 2. By Division – Women’s & Children’s and Corporate are both below the Trust target of 4% Medical vacancies remain above target with challenges in filling emergency department roles and at middle grade. An international campaign has begun to seek to fill these roles by September.
Workforce – Sickness Absence Summary Although the rolling sickness absence for this period remains over the Trust target of 3.5% (at 3.86%), the quarter-on-quarter figure does show a downward trend. Sickness absence is being actively managed by HR Business Partners and also by line managers, using the Health & Wellbeing Staff Off Sick support mechanism.
Performance Performance Exception Report : Q1 Variance in Performance • Currently the Trust is delivering on its performance plans. • The Trust has reported governance rating of Green for Quarter 1 and has seen marginal variations on planned activity. Clinical Income is on plan. • Therefore there are no material exceptions to report. 16
Performance - Activity Summary The activity plan shown is revised to take in to account the outcome of contractual negotiations with the CCG which concluded in month 1. Elective and day case activity is below plan due to the under delivery of planned developments. For day cases this is driven by Urology and T&O. For elective it is largely General surgery and Gastroenterology. Outpatients are over delivering against the revised plan, mainly in Cardiology. Variances between RDA and day case from last year is caused by a planned and agreed change in recording methodology. 18
Finance Finance Exception Report : Q1 Variance in Performance For Q1 the Trust reported a deficit of £1.5m, £ 0.4m down against plan. This resulted in an FRR of 2 which is consistent with plan. Increased costs of £1.2m were partially offset by £0.8m of additional income. Of the £1.2m increased costs, £0.8m was in relation to pay, the remainder was mainly in relation to under-delivery of Cost Improvement Programme (CIP). The pay variance was driven by a £1.5m overspend on consultant and doctors budgets. Against a CIP plan of £1.4m for the year to date, £0.5m was delivered. Actions Divisions have been tasked to produce detailed revised plans to return to target. These are well underway and are due to be delivered at their August performance meetings with Execs. These plans aim to fully identify CIPs. HR are leading on plans to address doctors pay. A Project Management Office (PMO) assurance process has been implemented to review and test all projects, but especially CIP plans. Further efficiency projects have been identified and scoped with Birch (Portering, ED, Housekeeping) Performance Recovery By the end of Q2 we expect to report a positive ‘in quarter’ surplus and to be delivering an FRR of 3. We expect to be achieving a cumulative surplus and on track to deliver the trust plan by Q3. 19
Financial Overview EBITDA and Surplus The Trust’s EBITDA and Surplus were both worse than plan at the end of Quarter 1. EBITDA was £1.56m (2.5% margin) while the deficit was £1.54m against a planned deficit of £1.17m. Cash The Trust held cash of £26.4m at the end of Quarter 1 which was lower than planned (£31.0m) because the drawdown of the agreed FTFF loan for the Radiotherapy development (£4.5m) was delayed from June into July. Financial Risk Rating The Financial Risk Rating (FRR) at the end of Quarter 1 was a 2 as planned. Cost Improvement Programme The Trust CIP target for 2013/14 is £9.65m. CIP Schemes have delivered £1.4m of recurring savings for the year. 20
Monitor Risk Rating Summary The Financial Risk Rating (FRR) at the end of Quarter 1 was as planned at 2. Weighted Average Risk Rating Definition 5 : Lowest risk - no regulatory concerns. 4 : No regulatory concerns. 3 : Regulatory concerns in one or more components. Significant breach of Terms of Authorisation is unlikely. 2 : Risk of significant breach in Terms of Authorisation in the medium term, e.g. 9 to 18 months in the absence of remedial action. 1 : Highest risk - high probability of significant breach of Terms of Authorisation in the short-term, e.g. less than 9 months, unless remedial action is taken. Additional Risk Indicators In addition to the FRR, Monitor reviews ten risk indicators that give an indication of whether there are financial risks within the Trust. They do not have a bearing on the formal risk rating. At Quarter 1, the Trust was compliant with all of these except Creditors and Debtors over 90 days. Details of the reasons for this are provided in this report under Debtors and Payments (page 13). FRR Thresholds See Appendix 1 for a table of FRR Thresholds 21
Income & Expenditure : Summary Summary At Quarter 1 the Trust delivered a deficit of £1.54m which is £0.38m worse than plan. The major drivers of this adverse variance are the overspend on pay and the under delivery of CIP. Other (non clinical) income shows a significant variance which is caused by a number of non-recurring items. These include staff recharges (£0.3m), income received for community dental services in relation to last year (£0.2m), lease car income (£0.1m), and a rate rebate (£0.1m). 22
Income 23
Pay 24
Non Pay 25
CIP Summary CIP is significantly off trajectory, with only 32% delivery of the year-to-date plan (£0.5m of £1.4m). For the full year, £1.6m of savings have been delivered against the plan of £9.6m. Only half of the CIP plan is supported by identified plans. CIP plans are under continuous review with Divisions to identify further schemes and to support delivery. 26
Balance Sheet Summary At the end of Quarter 1, the Trust held cash of £26.4m. This was lower than planned because the drawdown of the agreed FTFF loan for the Radiotherapy development was delayed from June into July. This also meant that non-current liabilities were lower by a corresponding amount. Other key balance sheet indicators are Debtors Processes are in place to ensure outstanding debts are under continuous review at all ages of debt. Total debtors have increased since Q4, particularly in the range of debtors under 30 days old. In the under 30 day range, 82% of invoices are NHS. In particular, there was a an SLA invoice to Mid Essex CCG (£1.8m) which has not been paid in the normal 14 days for SLA invoices. It was paid on 2 July. Payments PSPP performance is strong at 93%. 74% of invoices outstanding are under 30 days old and therefore within current payment terms. Creditors over 90 days relate to on going disputes where products have not been delivered or services have not been satisfactorily performed. 27
Capital Programme Summary This month, year-to-date capital spend on the programme is £2.5m against a budget of £2.9m. 28
Appendices 29
FRR Glossary Weighted Average Risk Rating Definitions Rating 5 - Lowest risk - no regulatory concerns Rating 4 - No regulatory concerns Rating 3 - Regulatory concerns in one or more components. Significant breach of Terms of Authorisation is unlikely Rating 2 - Risk of significant breach in Terms of Authorisation in the medium term, e.g. 9 to 18 months in the absence of remedial action Rating 1 - Highest risk - high probability of significant breach of Terms of Authorisation in the short-term, e.g. less than 9 months, unless remedial action is taken Glossary of terms EBITDA is earnings before deducting interest, taxes, depreciation and amortisation. It also excludes exceptional items and dividends. It is a measure of the performance of the "underlying business" i.e. the surplus/deficit from day to day operations and is similar to the directorate financial statements. EBITDA Margin This is EBITDA as a percentage of total income. EBITDA % Achieved This is designed to measure the ability of the Trust to achieve its financial plans. The target is therefore 100% or more. Financial Efficiency Net return after financing rating measures how efficiently the Trust uses its assets. It is defined as (I&E Surplus less PDC dividend, interest, PFI financing and other financial lease costs) divided by (total debt + total balance sheet PFI and finance leases + taxpayers equity). I&E Surplus Margin This is the Net Surplus as a percentage of total income. LiquidityThis ratio measures the Trust's ability to pay its bills from liquid assets (assets that are easily realisable), and is intended to show whether the Trust cancontinue to pay its bills in the short term. The metric shows for how many days the Trust could continue to pay its bills just using its net working capital. Net working capital (i.e. liquid assets) consists of cash in bank and debtors due in less than one year, less creditors /accrued costs due in less than one year. Over-riding Monitor Metric Rules The overall risk rating is a weighted average of the five metrics, but there are four rules that override this average: If any one metric is ranked at 1 or 2 than the maximum Trust rating is 3 If any 2 metrics are ranked at 1 or 2 then the maximum Trust rating is 2 3. If any 2 metrics are ranked at 1 then the maximum Trust rating is 1 4. If any metric is ranked at 1 then the maximum Trust rating is 2 NB For the purpose of these over-riding rules, the Financial Efficiency metrics are averaged together, leaving a total of 4 metrics against which these rules are tested 36