Download

1 / 18
180 likes | 435 Views
ARIS. Assess. Assessments provide critical information to set goals and monitor progress. Some assessments include: -Summative data -Needs assessments -Professional development notes -Classroom observations and student work Now you can use:

E N D
Assess • Assessments provide critical information to set goals and monitor progress. Some assessments include: -Summative data -Needs assessments -Professional development notes -Classroom observations and student work • Now you can use: -Progress Report and Periodic Assessments to gain valuable information -The Quality Review to maintain focus on collecting and reviewing data -ARIS (the Achievement Reporting and Innovation System) to access many layers of information, down to the individual student
Set Goals • Based on our determination of school strengths and weaknesses, we set goals outlined in: -Comprehensive Education Plan -Principal Performance Review (PPR) • Now we have a general system wide goal of progress. Our team determines which students are struggling most, and what progress means for our school, based on all of the information available.
Calendar of 3-8 Assessment Windows • Assessment options that may be given outside of these windows: • Customized/Item Bank • Computer Adaptive • DYO Reflecting on progress in the current year and planning over the summer for the next school year
Predictive Assessment What is it? • Covers the same content and skill areas for a given grade’s New York State test. • Performance Indicators will be assessed at the depth of knowledge and level of difficulty appropriate to the point in time at which a student is being assessed. • Measures students’ foundational skills for material that will be taught leading up to the New York State test.
Peer Index for Middle Schools • New peer indices were created by taking the school’s average Grade 4 ELA and Math proficiency rate. This is similar to the method used to create peer indices at the High School level, where Grade 8 scores determine the peer index. • In middle schools, 4th grade ELA and Math scores are more powerful predictors of middle school outcomes. Example: Average combined ELA and Math Grade 4 Proficiency Rate School A - 2.24 (the combined average 4th grade ELA and Math score of the school’s students was a low level 2) School B – 3.76 (the combined average 4th grade ELA and Math score of the school’s students was a high level 3) School A and B each have their own peer groups.
Navigating the Progress Report A Progress Report would include: • The Percentile score. What do the percentile score and category scores mean? • A “Peer Horizon” Score. If a“Peer Horizon” score was high, what might this indicate? • If the “Peer Horizon Score was low, what might this indicate? • A comparison of this year and last year’s scores. How could we use this?
Inquiry Teams as a Resource Thinking about questions we just reviewed may raise more questions about how to encourage the use of data at every level at our school. The development of an Inquiry Team can be a valuable resource in this ongoing work.
Work of the Inquiry Team School based teams investigate a small target population of struggling students using quantitative and qualitative data. Teams lead, develop, and implement instructional strategies, approaches and interventions on an ongoing basis, in response to data analysis. Teams share work to support grade-level and department team meetings. This past year, Empowerment Schools established Inquiry Teams. We had the opportunity to interview a few of them about their experiences.
ARIS Finding the Data We Need to Move Our Students
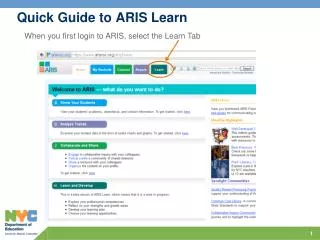
Navigation Tabs HomeAccess to ARIS features, links, school progress reports and communication messages Students and Classes View Student information both individually or comparatively within a class view. Analyze Creates standard reports, custom reports, and custom queries to compare data longitudinally and comparatively. Resources Search and contribute NYCDOE relevant resources including innovative ideas and effective practices Collaboration Toolbars for collaborating and sharing information throughout NYCDOE. Assess Access to NYCDOE assessment vendors
Example – Module 3Student and Classes Tab • Features of the Students and Classes Tab - Various class views - Student Profile
Example – Module 6Collaboration Tab • Features in the Collaboration Tab • Teamrooms • Threaded discussion • Blogs • User profiles – (future release) • Communities – (future release) • Online favorites – (future release)
Data Views • Data is pulled from multiple NYCDOE databases and deposited into views within ARIS - For example, the Student Profile displays the following data about a student (if available) and links at the top will allow you to jump to the various sections: • Summary • Transcript • Assessment History • ELL • LEP • Absences • Data is updated nightly • Access to the data is restricted to the level the user is given access.
Data and Analysis • Data in ARIS is viewed in 5 ways Student Profile Displays student specific information on one page Class Views Provides a snapshot view of all students in a class in relation to their student data Standard Reports Allows users to access reports immediately from a set of frequently used stock reports. Custom Reports A tool to customize reports by sorting parameters to obtain specific data that helps to identify students with specific problems Analyzer Compiles and looks at longitudinal data
Wrap-up • Use ARIS to: