Download
1 / 19
190 likes | 310 Views
This document outlines a robust approach for estimating variation in landscape analysis using GIS. It describes the processes of creating a spatial database, populating polygons with sample data, simulating changes, and generating insightful maps. Emphasizing the importance of uncertainty estimation in landscape simulations, the study undertakes an assessment of late seral forest area over 30 years, employing Monte Carlo techniques and bootstrap resampling methods. The guide serves as a valuable resource for scientists, managers, and policymakers involved in landscape change modeling and its applications.

E N D
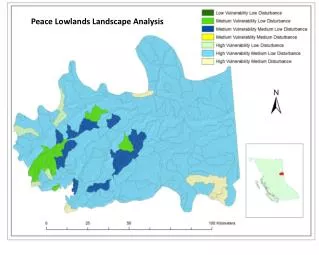
Introduction • General Approach • Create spatial database (GIS) • Populate polygons with sample data • Simulate change for variable of interest • Generate maps • Common Uses • Managerial • Scientific • Public policy Spatial Landscape Analyses: how & why?
Introduction Spatial Landscape Analysis: what? Hessburg, P.F., Smith, B.G., and R.B. Salter. 1999. Detecting Change in Forest Spatial Patterns from Reference Conditions. Ecological Applications, 9 (4) 1232-1252. Wales, B.C. and L.H. Suring. 2004. Assessment Techniques for Terrestrial Vertebrates of Conservation Concern. In: Hayes, J.L., Ager, A.A., and R.J. Barbour (Tech. Eds. Methods for Integrated Modeling of Landscape Change. USDA Forest Service GTR-610. pp 64-72.
Problem • The results of landscape simulation are often reported without an estimate of uncertainty 1995 2045 2095 http://www.fsl.orst.edu/clams/prj_lamps_simulation.html
Research Goals • To examine the potential effects of variation in sample data on the results of landscape simulation • To begin to develop ways to communicate these effects
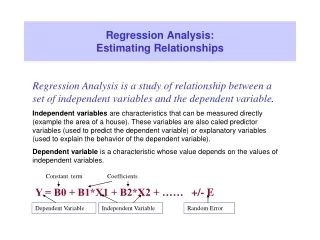
Study Objectives • Estimate the area of late seral forest (LSF) structure in a 6070 ha reserve over 30 years (FVS) Hummel) • Calculate the effect of sampling uncertainty on the estimates in each decade (Monte Carlo/SAS) (Cunningham)
Landscape Summary Matrix 18 13 11 10 SI SEOC SECC UR YFMS OFMS
Area of LSF Structure Basal area (BA) at least 55.2 m2/ha BA of trees greater than 61.0 cm dbh ≥ 8.3 m2/ha BA of trees greater than 35.6 cm dbh ≥ 33.1 m2/ha BA of trees less than 35.6 cm dbh ≥ 8.3 m2/ha If LSF=1 If not LSF=0
Bootstrap Re-sampling • Developed in the 1980s (Efron), based on classical statistical theory from the 1930s. • Computer-intensive method that creates an empirical distribution function of a statistic to estimate its true distribution function. • The SD of a sample of bootstrap means is the bootstrap estimate of the true SD of the mean.
What is a Bootstrap Sample? Xi=5 x*1 x*2 …… x*B 1 (15) 5 (12)3 ( 7 )…… 2 ( 4 ) 2 ( 4 ) 4 ( 9 )1 (15) …… 1 (15) 3 ( 7 ) 5 (12)2 ( 4) …… 4 ( 9 ) 4 ( 9 ) 3 ( 7 )2 ( 4 ) …… 5 (12) 5 (12) 1 (15)3 ( 7 ) …… 2 ( 4 ) =9.4=11.0=7.4 …… =8.8
Results 2 : LSF mean & SE Decade 1 1690 ha (se 233 ha) Decade 2 2060 ha (se 251 ha) Decade 3 3674 ha (se 109 ha)
Acknowledgements • Pat Cunningham • Tom Gregg • Tim Max Further information shummel@fs.fed.us Gregg, T.F.; Hummel, S. 2002. Assessing sampling uncertainty in FVS projections using a bootstrap resampling method. In: Crookston, N.L.; Havis, R.N., comps. Second Forest Vegetation Simulator Conference; 2002 February 12-14; Fort Collins, CO. Proc. RMRS-P-25. Ogden, UT: U.S. Department of Agriculture, Forest Service, Rocky Mountain Research Station: 164-167.