Regression Analysis: Estimating Relationships
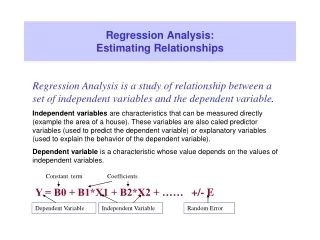
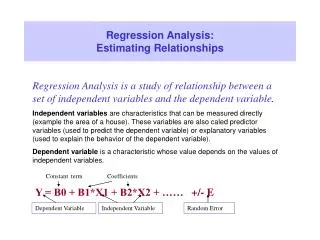
Dependent Variable. Independent Variable. Random Error. Regression Analysis: Estimating Relationships. Regression Analysis is a study of relationship between a set of independent variables and the dependent variable .

Regression Analysis: Estimating Relationships
E N D
Presentation Transcript
Dependent Variable Independent Variable Random Error Regression Analysis: Estimating Relationships Regression Analysis is a study of relationship between a set of independent variables and the dependent variable. Independent variables are characteristics that can be measured directly (example the area of a house). These variables are also caled predictor variables (used to predict the dependent variable) or explanatory variables (used to explain the behavior of the dependent variable). Dependent variable is a characteristic whose value depends on the values of independent variables. Constant term Coefficients Y = B0 + B1*X1 + B2*X2 + ……+/- E
Purpose of Regression Analysis Past / Experience / Known Future/Unknown time Now Explanation:Use regression analysis to develop a mathematical model to explain the variance in the dependent variable based on values of independent variables. Prediction: If the regression model adequately explains the dependent variable, use the model to predict values of the dependent variable. Explain Selling Price of a house (dependent) based on its characteristics (independents). If the model is valid, use it for prediction. Develop Regression Model using known data (sample) Selling Price = 40,000 + 100(Sq.ft) + 20,000(#Baths) If the above model is reliable and valid, Use this model to predict the Selling Price of any house based on its area (Sq.ft.) and the number of bathrooms (#Baths) The constant term (40,000) is the fixed price of the house. This is not dependent on the values of the variables considered. Can be interpreted as the price of the lot and transaction costs. The coefficient of Sq.ft. (100) is the change in Selling Price for an additional Square Foot. Can be interpreted as Price per Sq.Foot.
Procedure for Building Regression Models Define Objectives Define/Clarify Purpose. Identify and describe the measurement of the dependent variable. Select Variables Identify possible independent variables (predictors – should make sense). Use scatter plots and correlations for selection. Estimate Model Estimate Regression Coefficients (using least squares method). Test Model Test to see if all coefficients are significant (reliability). Establish validity (are relationships as expected, do predictions match actuals). Implement the model in Decision Support System. Incorporate error in predictions. Outline limitations/constraints of the model. Implement and Use Monitor Performance Compare predictions with actual values. Modify/Refine/Expand model if necessary. IT is about continuous improvement.
Selecting Independent Variables: Scatter Plots Scatter Plots are used to visualize the relationship between any two variables. For regression analysis, we are looking for strong linear relationship between the independent and dependent variable. Y-Intercept (Constant): Value of the dependent variable irrespective of the value(s) of the independent variable(s). X-Coefficient (Slope): Change in dependent variable per unit change in independent variable. Overhead = 3996 + 43 M_Hrs + 883 Runs R-Squared: Proportion of variance in dependent variable explained by independent variable(s).
Selecting Independent Variables: Correlation Analysis Correlation Coefficients are used to measure the linear relationship between any two variables. For regression analysis, we are looking for strong linear relationship between the independent and dependent variable, and low correlations among independent variables . Correlation of MachHrs with ProdRuns (should be low) Correlation of MachHrs with Overhead (should be high) Correlation of ProdRuns with Overhead (should be high) Multicollinearity exists when two independent variables are highly correlated (redundancy).
Simple Linear Regression • Linear regression function • One dependent and one independent variables • Mathematical form : Y = b0+ b1X + e • b0 and b1 are parameters (unknown constants) and their values are estimated from a known sample of X and corresponding Y. Estimated Model: Y-Pred = b0 + b1X Y-actual * e b0 and b1 are estimates (based on a sample) of b0 and b1 which are parameters (based on population) Estimation of b0 and b1 (coefficients) is done by the Least Squares Method. This method selects the line that has the smallest squared error Y-pred B1 = slope B0 = y -intercept X
Example of Simple Linear Regression: Defining Objective(s) Define Objectives • Pharmex is a chain of drugstores that operates around the country. • To see how effective their advertising and other promotional activities are, the company has collected data from 50 randomly selected metropolitan regions. • In each region it has compared its own promotional expenditures and sales to those of the leading competitor in the region over the past year. • So, Pharmex’s objective is to model the relationship between Promotion expenditures and Sales • Since Pharmex is interested in improving its sales, relative to its largest competitor, the dependent (outcome) variable for this situation is • Sales: Pharmex’s sales as a percentage of those of the leading competitor. This is the dependent (or predicted) variable.
Example of SLR: Select Independent Variable Variable Selection • The company expects that there is a positive relationship between the Relative measures of Sales and Promotion Expenditures, so that regions with relatively more expenditures have relatively more sales. • Promote: Pharmex’s promotional expenditures as a percentage of those of the leading competitor. This is the independent variable (or predictor variable), one which can be controlled by Pharmex. • Selection Criteria: • Based in Common Sense and Experience • Scatter Plots and Correlations • Description of Variables: • List each variable, how measured, and expected relationship with dependent variable. • In this section report results of Correlation Analyses, Scatter Plots, etc.
Pharmex ($) Competitor ($) Indexes (regr. data) Sales= Sp/Sc Promote = Pp/Pc Region Sales(Sp) Prom (Pp) Sales(Sc) Prom (Pc) Collect all relevant Data and Organize it in a Dataset – one which can be analyzed by a solver (like Excel) Example of SLR: Collect and Organize Data Data Collection
Example of SLR: Estimate Coefficients Estimate Model Regression Procedure in Excel R-Square: 45% of the variance in Sales is explained by Promote (model) Estimated Coefficients: Y-intercept (b0) = 25.12 Slope (b1) = 0.762 Sales-predicted = 25.12 + 0.762 Promote P-Value: Indicates the probability of making a Type I error (the possibility that the coefficient is = 0, that is there is no relationship). If this value is greater than .05 do not use the variable as a predictor.
Example of SLR: Testing the Model • Reliability and Validity: • Does the model make intuitive sense? Is the model easy to understand and interpret? • Are all coefficients statistically significant? (p-values less than .05) • Are the signs associated with the coefficients as expected? • Does the model predict values that are reasonably close to the actual values? • Is the model sufficiently sound? (High R-square, low standard error, etc.)
Example of SLR: Implementing and Using the Model Develop a Spreadsheet Model (Decision Support System) Estimated Decision Variable Forecast (regression formula) What-if Pharmex spent 160K on promotions? (Sensitivity analysis) What will Pharmex have to do to achieve 20% sales more than its competitor? (goal seeking) What will happen to Pharmex’s sales if its Competitor’s promotion can be any value between 130K and 140K? (Monte-Carlo Simulation)