Download
1 / 70
700 likes | 902 Views
CALCULATING SEA SURFACE TEMPERATURE, EMISSIVITY AND ATMOSPHERIC STATE USING HYPERSPECTRAL RADIANCES J. Le Marshall, J. Jung, W. L. Smith, E. Maturi, J. Derber, Xu Li, R. Treadon, S. Lord, M. Goldberg and W. Wolf. Overview. JCSDA – Background/Challenge/SST activity

E N D
CALCULATING SEA SURFACE TEMPERATURE, EMISSIVITY AND ATMOSPHERIC STATE USING HYPERSPECTRAL RADIANCES J. Le Marshall, J. Jung, W. L. Smith, E. Maturi, J. Derber, Xu Li, R. Treadon, S. Lord, M. Goldberg and W. Wolf
Overview • JCSDA – Background/Challenge/SST activity • Hyperspectral Data Assimilation • Hyperspectral emissivity/SST • Plans/Future Prospects • Summary
JCSDA Partners Pending
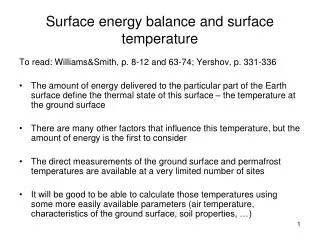
JCSDA Mission and Vision • Mission: Accelerate and improve the quantitative use of research and operational satellite data in weather. ocean, climate and environmental analysis and prediction models • Vision: A weather, ocean, climate and environmental analysis and prediction community empowered to effectively assimilate increasing amounts of advanced satellite observations and to effectively use the integrated observations of the GEOSS
The Challenge Satellite Systems/Global Measurements GRACE Aqua Cloudsat CALIPSO TRMM GIFTS SSMIS TOPEX NPP Landsat MSG Meteor/ SAGE GOES-R COSMIC/GPS NOAA/POES NPOESS SeaWiFS Jason Aura Terra SORCE ICESat WindSAT
5-Order Magnitude Increase in satellite Data Over 10 Years Satellite Instruments by Platform Daily Upper Air Observation Count NPOESS METEOP NOAA Windsat GOES DMSP Count Count (Millions) 1990 2010 Year Year
HIRS sounder radiances AMSU-A sounder radiances AMSU-B sounder radiances GOES sounder radiances GOES, Meteosat, GMS winds GOES precipitation rate SSM/I precipitation rates TRMM precipitation rates SSM/I ocean surface wind speeds ERS-2 ocean surface wind vectors Quikscat ocean surface wind vectors AVHRR SST AVHRR vegetation fraction AVHRR surface type Multi-satellite snow cover Multi-satellite sea ice SBUV/2 ozone profile and total ozone Altimeter sea level observations (ocean data assimilation) AIRS MODIS Winds … Satellite Data used in NWP >32 instruments
Sounding data used operationally within the GMAO/NCEP Global Forecast System
CURRENT SATELLITE DATA - STATUS ~ 9 new instruments Note: ADM – OSSEs Completed
Major Accomplishments • Common assimilation infrastructure at NOAA and NASA • Community radiative transfer model • Common NOAA/NASA land data assimilation system • Interfaces between JCSDA models and external researchers • Snow/sea ice emissivity model – permits 300% increase in sounding data usage over high latitudes – improved polar forecasts • MODIS winds, polar regions, - improved forecasts - Implemented • AIRS radiances assimilated – improved forecasts - Implemented • Improved physically based SST analysis - Implemented • Preparation for advanced satellite data such as METOP (IASI,AMSU,MHS…), , NPP (CrIS, ATMS….), NPOESS, GOES-R data underway. • Advanced satellite data systems such as DMSP (SSMIS), CHAMP GPS, COSMIC GPS, Windsat tested for implementation. • Impact studies of POES AMSU, HIRS, EOS AIRS/MODIS, DMSP SSMIS, Windsat, CHAMP GPS on NWP through EMC parallel experiments active • Data denial experiments completed for major data base components in support of system optimisation • OSSE studies completed • Strategic plans of all Partners include 4D-VAR
Hyperspectral/AIRS based SSTs William L. Smith, R.O. Knuteson, H.E. Revercomb, W. Feltz, H. B. Howell, W. P. Menzel, N. R. Nalli, Otis Brown, Peter Minnett and Walter McKeown. 1996: Observations of the Infrared Radiative Properties of the Ocean – Implications for the Measurement of Sea Surface Temperature via Satellite Remote Sensing. Bull. Amer. Meteor. Soc. 77, 41 – 51. Nalli, N.R., 1995. Sea surface skin temperature retrieval using the high resolution interferimeter sounder (HIS). M.S. Thesis, Dept. of Atmospheric and Oceanic Sciences, University of Wisconsin – Madison, 117 pp. …. George Aumann et al. 2006: …. . . . . . .
Development and Implementation Progress of Community Radiative Transfer Model (CRTM) P. van Delst, Q. Liu,F. Weng,Y. Chen, D. Groff, B. Yan, N. Nalli, R. Treadon, J. Derber and Y. Han …..
Community Contributions • Community Research: Radiative transfer science • AER. Inc: Optimal Spectral Sampling (OSS) Method • NRL – Improving Microwave Emissivity Model (MEM) in deserts • NOAA/ETL – Fully polarmetric surface models and microwave radiative transfer model • UCLA – Delta 4 stream vector radiative transfer model • UMBC – aerosol scattering • UWisc – Successive Order of Iteration • CIRA/CU – SHDOMPPDA • UMBC SARTA • Princeton Univ – snow emissivity model improvement • NESDIS/ORA – Snow, sea ice, microwave land emissivity models, vector discrete ordinate radiative transfer (VDISORT), advanced double/adding (ADA), ocean polarimetric, scattering models for all wavelengths • Core team (JCSDA - ORA/EMC): Smooth transition from research to operation • Maintenance of CRTM (OPTRAN/OSS coeff., Emissivity upgrade) • CRTM interface • Benchmark tests for model selection • Integration of new science into CRTM
Progress • CRTM v.0 used in NCEP SSI • CRTM v.1 has been integrated into the GSI at NCEP/EMC (Dec. 2005) • Beta version CRTM has been released to the public • CRTM with OSS (Optimal Spectral Sampling) has been established and is being evaluated and improved.
COMMUNITY RADIATIVE TRANSFER MODEL CRTM Below are some of the instruments for which we currently have transmittance coefficients. abi_gr (gr == GOES-R) airs_aqua amsre_aqua amsua_aqua amsua_n15 amsua_n16 amsua_n17 amsua_n18 amsub_n15 amsub_n16 amsub_n17avhrr2_n10 avhrr2_n11 avhrr2_n12 avhrr2_n14 avhrr3_n15 avhrr3_n16 avhrr3_n17 avhrr3_n18hirs2_n10 hirs2_n11 hirs2_n12 hirs2_n14 hirs3_n15 hirs3_n16 hirs3_n17 hirs3_n18hsb_aqua imgr_g08 imgr_g09 imgr_g10 imgr_g11 imgr_g12mhs_n18modisD01_aqua (D01 == detector 1, D02 == detector 2, etc) modisD01_terra modisD02_aqua modisD02_terra modisD03_aqua modisD03_terra modisD04_aqua modisD04_terra modisD05_aqua modisD05_terra modisD06_aqua modisD06_terra modisD07_aqua modisD07_terra modisD08_aqua modisD08_terra modisD09_aqua modisD09_terra modisD10_aqua modisD10_terra modis_aqua (detector average) modis_terra (detector average)msu_n14sndr_g08 sndr_g09 sndr_g10 sndr_g11 sndr_g12ssmi_f13 ssmi_f14 ssmi_f15 ssmis_f16 ssmt2_f14vissrDetA_gms5windsat_coriolis
IMPROVED COMMUNITY RADIATIVE TRANSFER MODEL CRTM OPTRAN-V7 vs. OSS for AIRS channels OSS OPTRAN
AQUA Hyperspectral Data Assimilation
AIRS Data Assimilation J. Le Marshall, J. Jung, J. Derber, R. Treadon, S.J. Lord, M. Goldberg, W. Wolf and H-S Liu, J. Joiner, and J Woollen…… 1 January 2004 – 31 January 2004 Used operational GFS system as Control Used Operational GFS system Plus AIRS as Experimental System
Table 1: Satellite data used operationally within the NCEP Global Forecast System
Improved NCEP SST AnalysisXu Li, John DerberEMC/NCEP • Progress • SST physical retrieval code has been merged into GSI and provided to NCEP marine branch for operational use • An extensive diagnostic study on the diurnal variation signals in in situ and satellite observations, SST retrievals, SST analysis and associated air-sea fluxes (NCEP GFS product) shows the SST diurnal variation needs to be addressed to improve the SST analysis product. • 7-day 6-hourly SST analysis has been produced with GSI, after a new analysis variable, in situ and AVHRR data were introduced into GSI. • Plan • Analyze SST by assimilating satellite radiances directly with GSI • Active ocean in the GFS • Aerosol effects AMS 2006 - Future National Operational Environmental Satellites Symposium Risk Reduction for NPOESS Using Heritage Sensors 24
Physical/Variational SST Retrieval Formulation Cost Function: is brightness temperature (radiance), skin temperature, atmospheric temperature vertical profile and atmospheric water vapor vertical profile respectively. is calculated with radiative transfer model. is the sensitivity of to respectively. Initially, the and are assumed not varying with height (z). Therefore, The sum of these sensitivities with height is used in the scheme for AVHRR data. Upper-subscription represents analysis, first guess and observation respectively. Lower-subscription means the channel index. is the error variance of and respectively The solutions of are solved by minimizing cost function J
Improved NCEP SST AnalysisXu Li, John DerberEMC/NCEP AMS 2006 - Future National Operational Environmental Satellites Symposium Risk Reduction for NPOESS Using Heritage Sensors 26
Global Forecast System Background • Operational SSI (3DVAR) version used • Operational GFS T254L64 with reductions in resolution at 84 (T170L42) and 180 (T126L28) hours. 2.5hr cut off
The Trial • Used `full AIRS data stream used (JPL) • NESDIS (ORA) generated BUFR files • All FOVs, 324(281) channels • 1 Jan – 15 Feb ’04 • Similar assimilation methodology to that used for operations • Operational data cut-offs used • Additional cloud handling added to 3D Var. • Data thinning to ensure satisfying operational time constraints
The Trial • AIRS related weights/noise optimised • Used NCEP Operational verification scheme.
AIRS Assimilation • Used 251 Out of 281 Channels - 73 - 86 Removed (Channels peak too High) - 1937 - 2109 Removed (Non LTE) - 2357 Removed (Large Obs – Background Diff.) • Used Shortwave at Night • Wavenumber > 2000 cm-1 Downweighted • Wavenumber > 2400cm-1 Removed
AIRS data coverage at 06 UTC on 31 January 2004. (Obs-Calc. Brightness Temperatures at 661.8 cm-1are shown)
Figure 5.Spectral locations for 324 AIRS selected channel data distributed to NWP centers.
Figure1(a). 1000hPa Anomaly Correlations for the GFS with (Ops.+AIRS) and without (Ops.) AIRS data, Southern hemisphere, January 2004
Figure 1(b). 500hPa Z Anomaly Correlations for the GFS with (Ops.+AIRS) and without (Ops.) AIRS data, Southern hemisphere, January 2004
Figure 2. 500hPa Z Anomaly Correlations 5 Day Forecast for the GFS with (Ops.+AIRS) and without (Ops.) AIRS data, Southern hemisphere, (1-27) January 2004
Figure3(a). 1000hPa Anomaly Correlations for the GFS with (Ops.+AIRS) and without (Ops.) AIRS data, Northern hemisphere, January 2004
Figure 3(b). 500hPa Z Anomaly Correlations for the GFS with (Ops.+AIRS) and without (Ops.) AIRS data, Northern hemisphere, January 2004
AIRS Data Assimilation J. Le Marshall, J. Jung, J. Derber, R. Treadon, S.J. Lord, M. Goldberg, W. Wolf and H-S Liu, J. Joiner and J Woollen January 2004 Used operational GFS system as Control Used Operational GFS system Plus AIRS as Experimental System Clear Positive Impact Both Hemispheres.Implemented -2005
AIRS Data Assimilation Error in AIRS fcst Error in AIRS fcst Error in AIRS fcst Error in AIRS fcst Error in control fcst Error in control fcst Error in control fcst Error in control fcst Error in control fcst Error in control fcst Error in control fcst Error in control fcst MOISTURE Forecast Impact evaluates which forecast (with or without AIRS) is closer to the analysis valid at the same time. Impact = 100* [Err(Cntl) – Err(AIRS)]/Err(Cntl) Where the first term on the right is the error in the Cntl forecast. The second term is the error in the AIRS forecast. Dividing by the error in the control forecast and multiplying by 100 normalizes the results and provides a percent improvement/degradation. A positive Forecast Impact means the forecast is better with AIRS included.
AIRS Data Assimilation Impact of Data density... 10 August – 20 September 2004
AIRS Data Assimilation Impact of Spectral density... 10 August – 20 September 2004
AIRS Data Assimilation AIRS in the GSI... 1 January – 15 February 2004
AIRS – GSI, v2, … GSI Contral 1/18 fovs v all fov AIRS
AIRS Data Assimilation Application of AIRS Radiances over land ,water and ice
Surface Emissivity (ε) Estimation Methods • IRSSE Model • Geographic Look Up Tables (LUTs) - CRTM • Regression based on theoretical estimates • Minimum Variance, provides Tsurf and ε * • Eigenvector technique • Variational Minimisation – goal
Regression IR HYPERSPECTRAL EMISSIVITY - ICE and SNOW Sample Max/Min Mean computed from synthetic radiance sample Emissivity Wavenumber From Lihang Zhou