Download
1 / 26
270 likes | 457 Views
ANALYSIS OF THE AIR QUALITY IN BOGOTA COLOMBIA IN THE LAST DECADE. Boris Galvis 1 , Jorge E. Pachon 1 , Barron H. Henderson 2 , Edison Ortiz 3

E N D
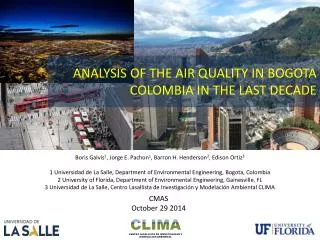
ANALYSIS OF THE AIR QUALITY IN BOGOTA COLOMBIA IN THE LAST DECADE Boris Galvis1, Jorge E. Pachon1, Barron H. Henderson2, Edison Ortiz3 1 Universidad de La Salle, Department of Environmental Engineering, Bogota, Colombia2 University of Florida, Department of Environmental Engineering, Gainesville, FL3 Universidad de La Salle, Centro Lasallista de Investigación y Modelación Ambiental CLIMA CMAS October 29 2014 CLIMA CENTRO LASALLISTA DE INVESTIGACION Y MODELACION AMBIENTAL
Outline • Motivation • Statistics for the City • Monitoring network description • Winds • PM10 trends • Ozone trends • Normalized variations • Why pollutants concentrations have improved? • Summary
Motivation • Bogota has achieved a significant improvement in its air quality during the last decade, however particulate matter concentrations in the city are still above WHO guideline values. • In this work we analyze the data reported between 2002 and 2012 by Bogota's Air Quality Monitoring Network (RMCAB), using OpenAirtools. • This project was funded by the Bogota’s district secretary for the environment (SDA), under Contract 1467 de 2013 "Development and Implementation of an Air Quality Model for Bogota".
Statisticsfor the City 2600 m.a.s.l. 8.5 million inhabitants 16 000 inhabitants /km2 16 000 km of roads 16 000 USD GDP per capita, 25% of Colombia’s GDP 15 °C average temperature, min 6 °C, max 24 °C 500 to 1000 mm / year of rain
Bogota’s air quality network (RMCAB)Spatial Coverage • 19 sites had been use to monitor concentrations across the city in the past decade • Currently the network 14 active monitoring sites with automatic monitors Active Bolivia Inactive Mobile Site
Bogota’s air quality network (RMCAB)Time coverage • The network has been monitoring since 1997 with ups an downs in its operation • In 2008 there was a major technological update of the monitoring network Years with sufficient time coverage for PM10
Bogota’s air quality network (RMCAB)Time coverage • In general, instruments to measure gases have scarcer data while particulate monitors (BAMs) have been more reliable. S R P RH R T WD WS SO2 NO2 CO PM2.5 PM10
Winds • We found considerable variability specially for wind directions across de city
PM10 trends Traffic - Industrial Urbanscale
PM10 trends Traffic Industrial Industrial Urbanscale Residential Industrial Industrial Residential
Particulatetrends Industrial Industrial Industrial Smooth trends show improvement across the city
Winds and particulate Calendar plot Parque Simon Bolivar 2012 Polar plot Annual average PM10 (ug/m3) PM10 (ug/m3)
PM10EXCEDANCES(24 HOUR STANDARD 100 µg/m3) ONI Monitoring Sites
O3 EXCEEDANCES (8 HOUR STANDARD 41 ppb) ONI Monitoring Sites
Normalized variations MON FRI SAT THU TUE WED SUN Normalized Level site: Puente Aranda Normalized Level site: Parque Simon Bolivar There are stronger and softer peaks for PM10, PM2.5, CO, SO2 and Nox between 07:00 and 11:00 and between 18:00 and 22.00 respectively As expected the peak of ozone occurs around noon.
Traffic counts on weekdays People goes to work around 6 am and comes back around 5, traffic is heavy all through the day
Daily variations SUBA USAQUEN Normalized Level Normalized Level MON TUE WED THU FRI SAT SUN MON TUE WED THU FRI SAT SUN CHICO CARVAJAL Normalized Level Normalized Level MON TUE WED THU FRI SAT SUN MON TUE WED THU FRI SAT SUN Ozone has higher concentrations on Sundays
Monthly variations SUBA USAQUEN Normalized Level Normalized Level J F M A M J J A S O N D CARVAJAL J F M A M J J A S O N D TUNAL Normalized Level Normalized Level J F M A M J J A S O N D J F M A M J J A S O N D June, July and August have the lowest pollutant concentrations
Why pollutants concentrations have improved? • Improved diesel quality may have had an impact • Tougher emission standards for mobile and industiral sources and actually enforcing them has also help to curb emissions Diesel Sulfur content PPM
Why pollutants concentrations have improved? Integrated transport system (SITP) implementation
PM10 concentrations Moving averages Colombia’s NAAQS WHO Guideline Tougher standards for mobile and industrial sources Clean Diesel Public transportation improvements
Summary • PM10 concentrations have gone down in the last decade • Particulate matter are still above WHO guideline values • During El Niño periods we can expect higher PM and Ozone concentrations • We are maybe in VOC limited regime • Introduction of lower sulfur fuels and improvement of public transportation might have had a
Thanks CLIMA CENTRO LASALLISTA DE INVESTIGACION Y MODELACION AMBIENTAL
Questions? CLIMA CENTRO LASALLISTA DE INVESTIGACION Y MODELACION AMBIENTAL