Download
1 / 25
250 likes | 267 Views
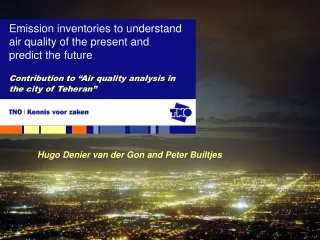
Emission inventories to understand air quality of the present and predict the future. Contribution to “Air quality analysis in the city of Teheran”. Hugo Denier van der Gon and Peter Builtjes. Contents. TNO organisation Why make emission inventories?

E N D
Emission inventories to understand air quality of the present and predict the future Contribution to “Air quality analysis in the city of Teheran” Hugo Denier van der Gon and Peter Builtjes
Contents • TNO organisation • Why make emission inventories? • Which sources? – Construction of an emission inventory • Examples of data base & maps • Satellite data to validate? • Examples of policy support questions Emission inventories @ TNO
TNO organisation • Knowledge in practiceTNO is a knowledge organisation for companies, government bodies and public organisations. The daily work of some 5,000 employees is to develop and apply knowledge. We provide contract research and specialist consultancy as well as grant licences for patents and specialist software. • TNO is active in five core areas: • TNO Quality of Life • TNO Defence, Security and Safety • TNO Science and Industry • TNO Built Environment and Geosciences • TNO Information and Communication Technology Emission inventories @ TNO
Ambition and outlook of the TNO business unit environmental health and safety We see • Increasing mobility and industrial activities • Intensification and more complex use of available land • Increasing demands on the quality of the (human) environment (EU directives) and increased, stricter enforcement • Citizens are better informed, have the right to know and have become more demanding and critical TNO - BU Environmental Health and Safety has the ambition to operate in the middle of these conflicting developments by making science applicable, providing policy support and technological solutions Emission inventories @ TNO
The need for Emission inventories • Determine the past and present situation • Identify (autonomous) changes and trends • Identify the (relative) importance of sources for (further) reducing the release of pollutants to the environment • Evaluate achieved emission reductions by policies, technological improvements, etc. • Input to explore further options for emission reductions including costs of measures • Input for predictive modeling of environmental distribution, exposure of ecosystems, source–receptor relationships Emission inventories @ TNO
Concept – DPSIR: The causal chain of Air Pollution Policy (e.g., regulation of emissions, filters, new technologies Causes (economic growth, increasing mobility) Responses Driving forces Responses Driving forces PM10, NOx, …… Pressures Pressures Impact Emissions of pollutants e.g. health, ecosystems State e.g. quality Emission inventories @ TNO
Emission sources… Emission inventories @ TNO
We distinguish two types of sources: Point sources and diffuse sources- Generally speaking diffuse sources are difficult to measure, quantify and control. Example: Sources of PM emission in industry • Point sources (canalized and emitted by stacks) • Production process units • Combustion for energy purposes (liquid and solid fuels) • Diffuse sources • Ventilation of production buildings • Production in open air • Material handling operations (storage and transport) Emission inventories @ TNO
Emissions Technology level By source • Technology_ID • Description • By country /grid Activities Emission Factors • Activity_ID • EF_ID • Sector • Technology_ID • Location • TSP PM10 PM2.5 • Time • EF-Value • AR-Value Example of TNO project:COORDINATED EUROPEAN PARTICULATE MATTER EMISSION INVENTORY PROGRAM (CEPMEIP) Covers all known anthropogenic emission causes of primary particulate matter; ~ 200 source categories - For each source category TSP, PM10 & PM2.5 emission factors derived. Emission factor : Representative index number that expresses the emission of a pollutant per unit of activity (e.g., g PM10 / GJ fuel) Emission is highly determined by emission control measures – technology level information is crucial! Emission inventories @ TNO
To keep an overview, sources are aggregated by type:Source sector as used for the gridded emission maps. Classification is based on the SNAP level 1 system with a more detailed split in SNAP 7 (road transport). Emission inventories @ TNO
Fuels (influence on emissions due to quality and composition): Heavy fuel oil Lighter fuel oil Gas Coal, brown coal, peat Wood Industrial waste Installation types (influence on emissions due to emission limits, removal efficiencies, Emission control technologies) Autoproducers (> 50 MWth) Other large boilers (50 - 300 MWth) Large and small furnaces where combustion gases and proces emissions are emitted through the same stack (covered by Industrial process emissions, 10 - 300 MWth) Small Boilers (< 50 MWth) But…in underlying inventory much detail is necessary! Example combustion in industry: Emission inventories @ TNO
Results: European PM10 emissions Present policies 2010 (incl. Kyoto) Despite differences, all sectors contribute!! Emission inventories @ TNO
Results: European antropogenic PM2.5 emissions in 2000 including international shipping Source: Visschedijk and Denier van der Gon, TNO, 2005 Emission inventories @ TNO
Sulphur dioxide (SO2) in Europe - I • The main emission sources of SO2 are combustion processes, especially the combustion of coal and heavy fuel oil. In addition there are non-ferrous metals smelting processes of which the ores are generally in sulphide form. • Activity data for fossil fuel combustion are taken from the IEA Energy Statistics [IEA 2003]. The IEA distinguishes several coal ranks and heavy and medium distillate fuel oils, as well as different types of lighter fuels and gasses. • Emission factors - Combustion related SO2 emission by fuel type i and process j is calculated according to: • Emissionfuel(i) = [Usefuel(i) x Sulphur contentfuel(i) - Sulphur retentionprocess(j)] x Removal efficiencyprocess(j) • Values per country, by fuel type and by process for sulphur contents, sulphur retention in ashes and removal efficiencies have been taken from RAINS 7.2. [Cofala et al. 1998]. (Not yet available for Iran) Emission inventories @ TNO
Sulphur dioxide (SO2) in Europe - II Source: Visschedijk and Denier van der Gon, TNO, 2005 Emission inventories @ TNO
Trends…. • Importance of sources shifts over time! • What is <10% today may dominate emissions in the future. Past Present Emission inventories @ TNO
Trends in Heavy-duty Vehicles Emission Reduction In Europe – In 2010 emissions per vehicle are ~10% of their 1980-90 level % reduction 100 90 80 70 60 50 40 30 20 10 0 PM 1980 1982 1984 NOx 1986 1988 1990 1992 1994 1996 1998 2000 2002 2004 2006 2008 2010 Euro I Euro II Euro III Euro IV Euro V Emission inventories @ TNO
PM2.5 emission in Europe in 1995 Mobile sources contribute 33% and 14% Source contributions are technology level dependent and therefore vary by region Emission inventories @ TNO
Road transport • Large activity growth • Decreasing tail pipe emissions due to technological improvements • None-tail pipe emissions (wear of tires etc.) follow the trend of acticity growth • Relative importance of non-tail pipe is increasing To make an inventory of road transport emissions we need to know: • Activity data – fuel consumption (by type: diesel, gasoline, LPG) by vehicle category (passenger cars, HDV, LDV, motorcycles) • fuel quality / composition (S content, Pb, ..) • technology level of fleet by year (emission limits, requirements) • Split in number of km driven urban / rural Emission inventories @ TNO
Select_Techn • Activity_ID • Technology_ID Technologies • Penetration • Technology_ID • Description Activities EmissionFactors • Activity_ID • EF_ID TNO Emissions Assessment Model TEAM • Sector • Technology_ID • Location • Pollutant • Time • EF-Value • AR-Value Emission inventories for AQ Teheran – what is needed? • Tables of the relational TEAM database need to be filled – asking for • activity (statistical) data on energy consumption, industrial production,….. • technologies present in Iran and their relative importance (penetration); • technology specific emission factors. Emission inventories @ TNO
Select_Techn • Activity_ID • Technology_ID Technologies • Penetration • Technology_ID • Description Activities EmissionFactors • Activity_ID • EF_ID IEA Energy Stats • Sector • Technology_ID • Location • Pollutant • Time • EF-Value • AR-Value Possible Approach:First order draft inventory Derived from Previous TNO studies Emission inventories @ TNO
Emission inventories for AQ Teheran – what is needed? Additional information on • Spatial location of sources to make emission maps • Technical information on important point sources such as stack height, heat output • Lower resolution and detail at the national scale to model background AQ, higher resolution and more accurate at the city scale Emission inventories @ TNO
Policy support examples • Which sources contribute most to high pollutant (limit exceedance) days • What would be a good indicator of health relevant exposure • Modelling of the impact on ambient concentrations due to planned infrastructural activities such as new industrial areas & additional roads • Source receptor matrices on a national and regional scale • Quantification of the fraction that can be mitigated by national/local measures • Advise on local measures to comply with limit values • Cost-effectiveness of various measures (e.g. transport vs industry) • Scenario analysis – backcasting & forecasting: what emissions are expected in 2010-2020 provided the known autonomous measures and/or signed protocols, policies etc. Emission inventories @ TNO
Thank you for your attention For more information or questions Peter.Builtjes@TNO.NL & Hugo.Deniervandergon@TNO.NL TNO, Apeldoorn, The Netherlands Emission inventories @ TNO