Download
1 / 31
430 likes | 1.07k Views
Neural Networks in Bioinformatics. I-Fang Chung ifchung@ym.edu.tw Institute of Bioinformatics, YM 4-27-2006. Experience and Education. 1989-2000 Electrical and Control Engineering in NCTU 2000-2003 (Postdoc) ECE: Laboratory of Intelligent Control

E N D
Neural Networks in Bioinformatics I-Fang Chung ifchung@ym.edu.tw Institute of Bioinformatics, YM 4-27-2006
Experience and Education • 1989-2000Electrical and Control Engineering in NCTU • 2000-2003 (Postdoc) ECE: Laboratory of Intelligent Control • 2003-2004 (Postdoc) Laboratory of DNA Information Analysis of Human Genome Center, Institute of Medical Science, Tokyo University • 2004-nowInstitute of Bioinformatics, Yang-Ming
Outline • Motivation • To solve one problem in bioinformatics • Identification of RNA-Interacting Residues in Protein • Current projects
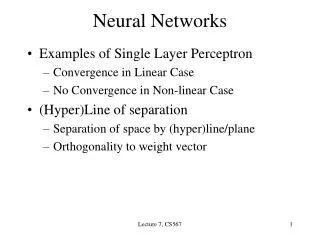
Neural Networks • Neural networks are constructed to resemble the behavior of human brains (neurons) • Characterizes the ability to learn, recall, and generalize fromtraining patterns x1 Weights wi1 x2 wi2 yi neti a(.) Output path xm wim
y w v x x x n 1 2 Neural Networks (cont’d) • Good at tasks such as pattern matching, classification, function approximation, and data clustering • Good at tasks in bioinformatics such as coding region recognition, protein structure prediction, gene clustering
Basic Principles of Discrimination • Each object associated with a class label (or response) Y {1, 2, …, K} and a feature vector (vector of predictor variables) of G measurements: X = (X1, …, XG) • Aim:predict Y from X. Predefined Class {1,2,…K} K 1 2 Objects Y = Class Label = 2 X = Feature vector {colour, shape} Classification rule ? X = {red, square} Y = ?
Example Learning set Bad prognosis recurrence < 5yrs Good Prognosis recurrence > 5yrs ? Good Prognosis Matesis > 5 Predefine classes Clinical outcome Objects Array Feature vectors Gene expression new array Reference L van’t Veer et al (2002) Gene expression profiling predicts clinical outcome of breast cancer. Nature, Jan. Classification rule
Design Issues Human brain Domain knowledge, e.g. biology (molecule, chemistry) Problem definition (desired input/output mapping) Output encoding Neural Network Applications Molecular Structure Sequence discrimination Feature detection Classification Structure prediction DNA:ATGCGCTC Protein:MASSTFYI Pre-Processing : Post-Processing : : Training Data Sets Testing Data Sets System Evaluation Network Architecture Learning Algorithm Parameter adjustment Feature representation (knowledge extraction) Input encoding
Prediction of Protein 2ndStructures Adopted from Qian and Sejnowski, 1988
y1 y2 y3 w x1 x2 x3 Sliding Window Chain_1 2-D info Chain_2 Chain_3 … Amino Acids • Sliding window concept • Considering a piece of strings as inputs • Only looking at central position in a piece of strings to detect what kind of 2-D info. happens
Binary Bit Encoding Method 000001000000000000000 • Input encoding for each input pattern • Unary encoding scheme for protein sequence • 21 binary bits for 20 kinds of amino acid type (1 bit for overlapped terminal) • Input layer with multiple Input patterns • A window size ‘w’ of consecutive residues been considered. • ‘21* w’units for sequence only • Output layer with 3 units • To describewhat kind of 2-D info. Happens (‘1, 0, 0’ for helix, ‘0, 1, 0’ for sheet, ‘0, 0, 1’ for coil) • One hidden layer for non-linear 2-class pattern classification w
More Complex NN Structure: PHD Multiple sequence Alignment, it is a way to compare multiple sequence, the result is called alignment profile. breakthrough:use evolutionary information in MSA instead of single sequence Adopted from Rost and Sander, 1993
Outline • Motivation • To solve one problem in bioinformatics • Identification of RNA-Interacting Residues in Protein • Current projects
Identification of RNA-Interacting Residues in Protein • Task • Predicting putative RNA-interacting sites within a protein chain • Given a protein sequence Finding the RNA-binding positions (residues) • Method • Using feedforward neural network based on sequence profiles • Analyzing and qualifying a large set of the network weights trained on sequence profiles
Data Generation • Source: Protein Data Bank (PDB) • Collect Protein-RNA complexes, resolved by X-ray with ≤ 3.0Å • Remove redundant protein structures with sequence identity over 70% • 86 non-homologous protein chains (21990 residues) • Residues in interaction sites • The closest distance between atoms of the protein and the partner RNA is less than 7Å. • hydrogen bonds, stacking, electrostatic, hydrophobic, and van der Waals, interactions considered • Residues in interaction sites: 21.7% (4782)
y1 y2 w x1 x2 x3 Classifier Chain_1 interaction site or not Chain_2 Chain_3 Amino acids … 2D info. Appearance probability
PSSM • Position Specific Iterative BLAST (PSI BLAST) • A strong measure of residue conservation in a given location • Position specific scoring matrix (PSSM) • A20-dimensional vector representing probabilities of conservation against mutations to 20 different amino acids including itself • The position of the important function of protein will be kept in the course of evolving
Experimental Results (cont’d) • Agreement with structural studies of protein-RNA interactions • Arg, Lys, Ser, Thr, Asp and Glu prefer to be in hydrogen bonding • Phe and Ser are frequently located in van der Waals interacting and stacking interacting • Some conflicting situations • Ala, Leu and Val known to less preferred types in interactions • Asn typically though of one of the most preferred amino acid types in hydrogen bonding Adopted from Jeong and Miyano, 2006
Saliency Factor • Objective: Define a matrix to represent the importance of the presence of specific residues at specific positions • Step1: Normalization of weight xijfor each input unit aij M : the window size, 1 ≤ i ≤ M N : the # of distinct residue symbols, 1 ≤ j ≤ N H : the # of hidden units, 1 ≤ k ≤ H Adopted from Jeong and Miyano, 2006
Saliency Factor (cont’d) • Weight conservation : the amount of weight information represent at each position i in the given window, defined as the difference between the maximum entropy and the entropy of the observed weight distribution • Saliency factor of residue j at windowposition i • New input M : the window size, 1 ≤ i ≤ M N : the # of distinct residue symbols, 1 ≤ j ≤ N H : the # of hidden units, 1 ≤ k ≤ H Adopted from Jeong and Miyano, 2006
Notations • Four kinds of measuring parameters are defined: • True Positive (TP):the number of accurately predicted interaction sites • True Negative (TN):the number of accurately predicted not-interaction sites • False Positive (FP):the number of inaccurately predicted interaction sites • False Negative (FN):the number of inaccurately predicted not-interaction sites • Examples: (1: positive, 0: negative)0101000010011001111000 Observed 1100001110001111110011 Predicted TN FN FP TP
Measuring Performance • Total accuracy: • Percentage of all correctly predicted interaction and not-interaction sites • Accuracy (Specificity): • To measure the probability that how many of the predicted interaction sites are correct • Coverage (Sensitivity): • To measure the probability that how many of the correct interaction sites are predicted • Mattews correlation coefficient (MCC): • Takes into account both under- and over-predictions • ranges between 1 (perfect prediction) and -1 (completely wrong prediction)
Our method ATGpr Receiver Operating Characteristic (ROC) Curve
Experimental Results Adopted from Jeong and Miyano, 2006
Experimental Results (cont’d) Adopted from Jeong and Miyano, 2006
Experimental Results (cont’d) underpredicted interaction overpredicted not-interaction Adopted from Jeong and Miyano, 2006
References • E. Jeong, I F. Chung, and S. Miyano, “Prediction of Residues in Protein-RNA Interaction Sites by Neural Networks,” Proc. of the 14th International Conference on Genome Informatics, pp. 506-507, 2003. • E. Jeong, I F. Chung, and S. Miyano, “A Neural Network Method for Identification of RNA-Interacting Residues in Protein,” Proc. of the 4th International Workshop on Bioinformatics and Systems Biology, pp. 105-116, 2004. • E. Jeong and S. Miyano, “A weighted profile based method for protein-RNA interacting residue prediction,” Trans. on Comput. Syst. Biol., IV, LNBI 3939, pp. 123 - 139, 2006.
Current Projects • To discover the relationship between protein sequence and protein structure • To identification of RNA-interacting residues in protein • To perform protein metal binding residue prediction • To predict the phosphorylation sites • Microarray data analysis • Significant gene selection, clustering, classification • Prediction of the polymorphic short tandem repeats
Mini-Workshop: Knowledge Discovery Techniques for Bioinformatics Dr. Limsoon Wong
Hierarchy of Protein Structure 2nd structure prediction 3rd structure prediction
Protein Secondary Structures Anti-parallel beta sheet Alpha helix loop Parallel beta sheet