Download
1 / 29
290 likes | 300 Views
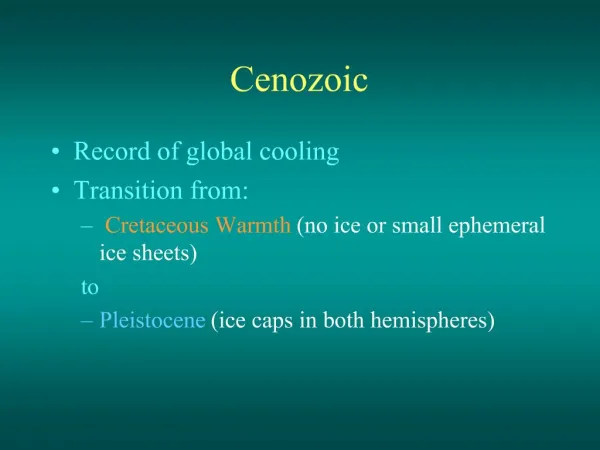
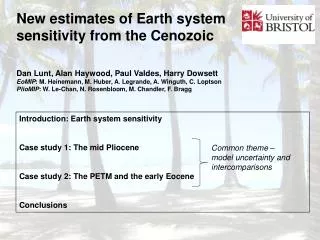
This project aims to construct a model of the Cenozoic Icehouse Earth, focusing on the relationships between erosion, tectonic forcing, atmospheric carbon, and surface temperature. The model utilizes data from the Himalayas and investigates the impact of changing precipitation rates on carbon cycling. Challenges include finding these relationships, understanding the modeling software, and addressing the complexity of the system.

E N D
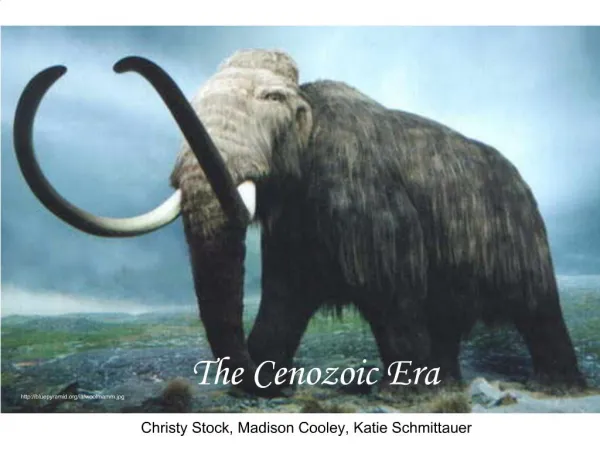
Modeling the Cenozoic Icehouse Earth ERTH 500 Mayra Dudrenova Symone Hopkins Adam Rincon
Original Model • In-class Himalayan Rock Mass Module • Assumed a lot of simplifications • Difficulties constructing the model a)Finding relationships between erosion and other the converters. b)Using the given equations to type in relationships c) Trouble with thecomplexity of therelationships d)Understand Stella and its various components Rock Module
Complete Model -Model obtained from class folder -More complex and interconnected
Default Model Configuration •Run Specs –Model runs for 60 million years –Time step is 5,000 years –Takes 1 minute, 45 seconds to run on 2015 MacBook Pro laptop •Tectonic Forcing –No collision for 10 million years (10 Myrs) •Allows model to approach equilibrium in pre-collision environment –India collides with Asia 50 Myrs ago •Initial rate = 3 cm/year •Declines steadily to 1.5 cm/year over next 10 Myrs •Stays steady at 1.5 cm/year for last 40 Myrs –Sea-floor spreading (and so volcanic outgassing) stays constant the whole time
Default Model Configuration (cont’d) •Atmospheric Carbon and Surface Temperature –Initial mass of atmospheric carbon = 1068 Gtons •Approximately model’s steady-state value, pre-collision •Perhaps 60% of actual amount 50 Myrs ago? •Pre-collision weathering rate too high? – Initial temperature: 289.5 K (26.4°C) •Much colder (9 - 10°C?) than Earth 50 Myrs ago •Reflects under-calculation of atmospheric carbon
Model Graph after decreasing Indian Crust Speed by a factor of 10
Model Graph after decreasing Indian Crust Speed by a factor of 10
Results of the Experiment • Mountain Height decreased from 6800 meters to 680 meters. • Erosion rate decreased by power of 10 • Tectonic Convergence decreased by power of 10 • Atmospheric Carbon increased from 752 Gtons to 1061 Gtons • Silicate Weathering Mts decreased from 11608 Gtons to 240 Gtons • Silicate Weathering Global increased from 58392(Gt/Myr) to 69760 (Gt/Myr)? • Tsfc increased from 288(K) to 289(K) • Mtn Precipitation Rate decreased from 2.5 m/yr to 0.92m/yr
Carbon module in the Himalayas By Mayra Dudrenova
My original Carbon model • It has 3 reservoirs with 2 flows going from atmospheric carbon mass to carbon mass in the ocean. • The first flow is for weathering of the Himalayas and the second flow for the global weathering rate. • Riddled with errors, and missing values (as seen by the ?)
Second phase This model ran, but the carbon would go to zero if you tried to run it to a million years and with a faster running speck of DT: 2. We wanted to go all the way to 50 million years, so this wouldn’t do.
Long Term Inorganic Carbon Budget: Atmospheric Carbon, Weathering, and Global mean Surface temperature and Precipitation
Simulation: Default Configuration Atmospheric Carbon, Weathering, and Global Mean Surface Temp
Results of experiment Increased the CWRMtnRef From 7.0e4 to 7.0e14. Model would not run because it said that it had to divide by zero or the value is too high for the DT to handle.
Results of experiment • Purple line: Carbon mass in atmosphere decreased to 752 Gt • Green line 1: Temperature decreased by 2 degree K. • Orange line: global SWR started at 70,000 and decreased to ~58,000. • Green line 4: Mtn SWR started at 0 and increased to 12,000.
Precipitation module in the Himalayas by Symone Hopkins
The Precipitation Component configure a precipitation rate based on Contemporary rates over the himalayas Rates over flat land Determine Linear relationship between precipitation rate and mountain height *completely components, there are no reservoirs or sources/sinks
Importance to System Higher Precipitation→ higher erosion More Co2→ warmer planet→ potential to hold more water→ more precipitation Needed for modleing Mountain dimensions ie height, length, etc.
General Equation Rate of water mass = the change in mixing ratio x (mountain length x height of slope) x flux of air mass through unit of surface area at mountain base Assumptions: Temperature at base of mountain Air pressure at mountain base Found quantities: Water vapor pressure Air density at bottom of mountain Temperature at the top of the mountain Wind upslope speed
My graph Unable to run my graph due to an unidentified issue within my model most likely an equation written incorrectly.
Modeling comments . straight forward as a program .difficult to find errors when you get an unexpected result .syntax is important .difficult to find upslope wind velocity
Simulation: Default Configuration Himalayan Precipitation Rate
Differences My equation sheet Given equation sheet
What happens when average precipitation rate is changed? 20% increase