Download
1 / 21
210 likes | 342 Views
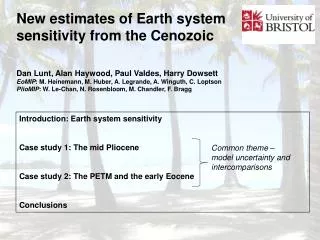
New estimates of Earth system sensitivity from the Cenozoic. Dan Lunt, Alan Haywood, Paul Valdes, Harry Dowsett EoMIP : M. Heinemann, M. Huber, A. Legrande, A. Winguth, C. Loptson PlioMIP : W. Le-Chan, N. Rosenbloom, M. Chandler, F. Bragg. Introduction: Earth system sensitivity

E N D
New estimates of Earth system sensitivity from the Cenozoic Dan Lunt, Alan Haywood, Paul Valdes, Harry Dowsett EoMIP: M. Heinemann, M. Huber, A. Legrande, A. Winguth, C. Loptson PlioMIP: W. Le-Chan, N. Rosenbloom, M. Chandler, F. Bragg Introduction: Earth system sensitivity Case study 1: The mid Pliocene Case study 2: The PETM and the early Eocene Conclusions Common theme – model uncertainty and intercomparisons
Climate sensitivity the change in global mean near-surface air temperature that would result from a sustained doubling of the atmospheric CO2 concentration “likely to be in the range 2 to 4.5°C with a best estimate of about 3°C, and is very unlikely to be less than 1.5°C. “ IPCC, AR4, 2007 Given a CO2 change, can estimate global mean temperature response Given a temperature change, can estimate CO2 change
But….. Knutti and Hegerl, Nature Geoscience, 2008 (1) ….official definition is century-scale (short-term feedback processes only). (2) Even models that do include dynamic oceans neglect many other processes…. Therefore define EARTH SYSTEM SENSITIVITY – long-term response to sustained elevated CO2 concentrations, including all Earth system feedbacks.
….combined model - data approach…. • (has advantages vs. ‘pure-data’ or ‘pure-modelling’ approaches) • Find a palaeo time period when • (a)CO2 was higher than modern (i.e. not the LGM!) • (b) we have an idea of ice sheets and palaeogeographies and other boundary conditions…. • Run a climate model with the elevated CO2 and prescribed (from data) ice and vegetation….compare with proxy data where available. • Modelled global mean temp will give the long-term climate sensitivity (Earth System Sensitivity) to this CO2 forcing. Model is an ‘interpolator’ of paleo data.
(1) CASE STUDY 1: The mid-Pliocene…. Boundary conditions from the PRISM2 project, USGS CO2 prescribed as 400 ppmv
Mid-Pliocene simulated temperatures compared with pre-industrial: CO2 = 400ppmv ΔT=3.3oC
Mid-Pliocene simulated temperatures compared with data ‘Global-annual mean’ response is good, but…. Dowsett et al, PPP, 2011
Implications for Earth system sensitivity: Orography forcing Total mid-Pliocene temp change, relative to pre-industrial Ice feedbacks Direct contribition from CO2 (“climate sensitivity”) Vegetation feedbacks Feedbacks due to CO2 alone EARTH SYSTEM SENSITIVTY
CO2 = 400ppmv… dTCO2 = 1.6oC dTESS = 2.3oC Lunt et al, Nature Geoscience, 2010
Model dependence?? PlioMIP Haywood et al., GMD, (2011)
New boundary conditions (PRISM3)… Vegetation: Orography: Based on Markwick (2007) : derived from lithologic, tectonic and fossil information, the lithologic databases of the Chicago Paleogeographic Atlas Project, and DSDP/ODP data. Salzmann et al., GPC, (2008) Ice: Hill et al (2007)
PlioMIP ensemble: Hadley 3.3 oC GISS 2.1 oC CO2 ~ 400ppmv… MIROC 3.5 oC CCSM4 1.8 oC NOR-ESM 3.2 oC ECHAM 3.3 oC Haywood et al, in prep
The mid-Pliocene: summary • Initial work suggested ESS ~ 4.6oC, ESS/CS ~ 1.5 • PlioMIP with new boundary conditions suggests ESS ~ 3.6oC – 7oC, (ESS/CS ~ 2 for HadCM3) • Future – more Earth system components into the models, assessment of orbital contribution.
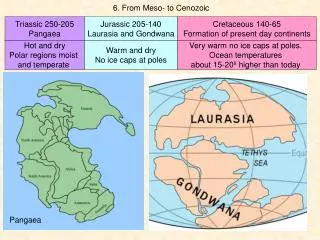
(1) CASE STUDY 2: The early Eocene …. Eocene: boundary conditions Palaeogeography (~55 - 50 Ma)
Eocene: boundary conditions (2) CO2 1680ppmv = 6* 1120ppmv = 4* 560ppmv = 2* Beerling and Royer, Nature Geoscience, (2011)
Runs at 1,2,4,6 * pre-industrial CO2. ~3500 years CS ~ 4.5 oC Global mean temperature vs CO2 forcing CS ~ 3.3 oC Lunt et al, Geology, 2010.
Now include vegetation feedbacks (i.e. consider a closer approximation to Earth system sensitivity….) ESS ~ 5 oC CS ~ 3.3 oC Global mean temperature vs CO2 forcing Loptson et al, in prep.
Model dependence?? • EoMIP: HadCM3 (Lunt et al, 2011), CCSM (Huber and Caballero, 2011), GISS (Roberts et al, 2010), ECHAM (Heinemann et al, 2009), CCSM (WInguth et al, 2010) terrestrial annual mean SST as a function of CO2 and model..
Model results compared with data (terrestrial) Data points from Huber and Caballero, CP, 2011. Leaf-margin analysis and/or CLAMP, + isotopic, geochemical, and pollen estimates. Lunt et al, in prep.
The early Eocene: summary • Vegetation feedbacks increase sensitivity by ~50% • EoMIP suggests models can produce good agreement with (most) data (but over a wide range of CO2). • Future – more coordinated modelling study.
Outlook • Don’t believe absolute numbers from a single model!! But….. • Real potential for the palaeo community to make a crucial contribution to future climate predictions, by quantifying and ‘scoring’ model performance under warm climate conditions….but…. • Need a consistent and comprehensive analysis of uncertainty in both temperature and CO2 estimates.