Download
1 / 49
490 likes | 584 Views
This study by Mogens Fosgerau and Robin Lindsey explores the impact of traffic incidents in trip-timing decisions using the bottleneck model. It covers literature review, model analysis, user equilibrium, system optimum, numerical examples, and further research conclusions. The research compares no-toll user equilibrium, system optimum, quasi-system optimum, and full optimum scenarios to determine optimal departure rates under various traffic conditions and incidents. Insights from scheduling utility and incident duration calibration are used to quantify the effects on travel cost and departure time adjustments. The study highlights the complexities of traffic management under incident conditions and offers recommendations for decision-making strategies.

E N D
Trip-timing decisions with traffic incidents in the bottleneck model Mogens Fosgerau (Technical University of Denmark; CTS Sweden; ENS Cachan) Robin Lindsey (University of British Columbia) Tokyo, March 2013
Outline • Literature review • The model • No-toll user equilibrium • System optimum Quasi-system optimum Full optimum • Numerical examples • Conclusions/further research
Literature on traffic incidents Simulation studies: many Analytical static models Emmerink (1998), Emmerink and Verhoef (1998) … Analytical dynamic models (a) Flow congestion. Travel time has constant and exogenous variance. Gaver (1968), Knight (1974), Hall (1983), Noland and Small (1995), Noland (1997). (b) Bottleneck model. Travel time has constant, exogenous and independent variance over time. No incidents per se. Xin and Levinson (2007). (c) Bottleneck model with incidents Arnott et al. (1991, 1999), Lindsey (1994, 1999), Stefanie Peer and Paul Koster (2009).
Bottleneck model studies Scheduling utility approach Vickrey (1973), Ettema and Timmermans (2003), Fosgerau and Engelson (2010), Tseng and Verhoef (2008), Jenelius, Mattsson and Levinson (2010).
Outline • Literature review • The model • No-toll user equilibrium • System optimum Quasi-system optimum Full optimum • Numerical examples • Conclusions/further research
Scheduling utility: Zero travel time As in Engelson and Fosgerau (2010) Move from H to W at t* u
Outline • Literature review • The model • No-toll user equilibrium • System optimum Quasi-system optimum Full optimum • Numerical examples • Conclusions/further research
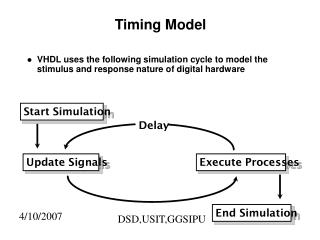
No-toll user equilibrium in deterministic model cumulative departures cumulative arrivals Queuing time u
No-toll user equilibrium with major incidents cumulative departures Driver m causes incident cumulative arrivals u
No-toll user equilibrium properties Similar to pre-trip incidents model.
No-toll user equilibrium (cont.) Similar to pre-trip incidents model.
Outline • Literature review • The model • No-toll user equilibrium • System optimum Quasi-system optimum Full optimum • Numerical examples • Conclusions/further research
System optimum Deterministic SO Maximize aggregate utility. Optimal departure rate = s (design capacity) Stochastic SO Maximize aggregate expected utility. What is optimal departure rate?
System optimal approaches Quasi-system optimum (x) Departure rate Choose optimal Full optimum (w) Choose optimal and
Outline • Literature review • The model • No-toll user equilibrium • System optimum Quasi-system optimum (QSO) Full optimum • Numerical examples • Conclusions/further research
Outline • Literature review • The model • No-toll user equilibrium • System optimum Quasi-system optimum Full optimum • Numerical examples • Conclusions/further research
System optimum with queue persistence cumulative departures Driver m causes incident cumulative potential arrivals n
Departure rate n Interval 1 Interval 2
Outline • Literature review • The model • No-toll user equilibrium • System optimum Quasi-system optimum Full optimum • Numerical examples • Conclusions/further research
Calibration of schedule utility functions Source: Tseng et al. (2008, Figure 3)
Calibration of schedule utility functions (cont.) Source: Authors’ calculation using Tseng et al. mixed logit estimates for slopes.
Calibration of incident duration Mean incident duration estimates Golob et al. (1987): 60 mins. (one lane closed) Jones et al. (1991): 55 mins. Nam and Mannering (2000): 162.5 mins. Select:
Other parameter values N = 8,000; s = 4,000 f(n)=f, fN = 0.2
Results: Major incidents Total cost of incident in NTE
Results: Major incidents Total cost of incident in QSO
Results: Major incidents Total cost of incident in NTE Total cost of incident in QSO
Results: Major incidents, individual costs NTE, no incident occurred NTE, incident occurred
Results: Major incidents, individual costs NTE, no incident occurred NTE, incident occurred QSO, incident occurred QSO, no incident occurred
Minor incidents Complication: NTE departure rate depends on lagged values of itself • No closed-form analytical solution. • Requires fixed-point iteration to solve. • Results reported here use an approximation.
Results: Minor incidents Initial departure time
Results: Minor incidents Increase in expected travel cost due to incidents
Modified example with SO different from QSO s = 4,000 N = 3,000 fN = 0.4 Explanation for parameter changes: • Shorter peak: Lower cost from moderating departure rate • Higher incident probability and duration: Greater incentive to avoid queuing by reducing departure rate
Results: Modified example Departure rates for QSO and SO
6. Conclusions (partial) • Properties of SO differ for endogenous-timing and pre-trip incidentsmodels • Plausible that QSO is a full SO: optimal departure rate = design capacity (same as without incidents), but with departures beginning earlier
Future research Theoretical • Further properties of NTE and QSO for minor incidents. • SO for minor incidents. • Stochastic incident duration Caveat: Analytical approach becomes difficult! Empirical • Probability distribution of capacity during incidents • Dependence of incident frequency on level of traffic flow, time of day, etc.
Thank you mf@transport.dtu.dk