Enhancing Trace Visualization with Vizen: Overcoming Challenges in Systems Performance Analysis
The Vizen Trace Visualization Tool is designed to optimize the analysis of system performance by addressing the complexities associated with strace data. Users often face challenges with high-dimensional data, overwhelming details, and difficulty in organizing and understanding trace information. Vizen introduces abstraction, allowing multiple views that highlight key performance indicators and relationships within trace data. This facilitates intuitive navigation and aggregation, helping users efficiently identify bottlenecks and maintain performance measurement with low overhead.

Enhancing Trace Visualization with Vizen: Overcoming Challenges in Systems Performance Analysis
E N D
Presentation Transcript
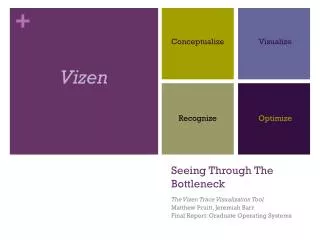
Conceptualize Visualize Vizen Recognize Optimize Seeing Through The Bottleneck The Vizen Trace Visualization Tool Matthew Pruitt, Jeremiah Barr FinalReport: Graduate Operating Systems
The Problem • The tool • strace • Copious amounts of data • Difficult to read for users unfamiliar with the stracesyntax • top • Hard to organize processes and limit the view • Doesn’t relate different performance measures • Visualizing The Trace • High dimensionality in the trace • Aggregating data from trace and other processes can cause high overhead open("/lib64/libdl.so.2", O_RDONLY) = 3 read(3, "\177ELF\2\1\1\0\0\0\0\0\0\0\0\0\3\0>\0\1\0\0\0\20\16\30040\0\0\0"..., 832) = 832 fstat(3, {st_mode=S_IFREG|0755, st_size=23360, ...}) = 0 mmap(0x3034c00000, 2109696, PROT_READ|…
The Solution • Abstraction • Create multiple views showing key points in the data • Allows users to see connections between trace data and various aspects of system performance • Users can drill down to pertinent information • Allows user to easily to aggregate data that would normally be provided in strace • Difficulties • Measuring statistics nearly concurrently • Maintaining low overhead • Displaying data in such a way that the user can quickly and intuitively see bottlenecks
/proc Virtual File System /proc/PID fd Folder containing symbolic links to open files stat File containing various statistics about a program, including page faults and CPU utilization
The Diagram of The Solution strace /proc VFS JProcExplorer JProcessParser JTraceDataModel JPerfDataModel JBarChart JXYPlot JGlobalView Vizen
Future Work • Still need to combine all views • Implement text filtering • Performance tuning