Download

1 / 10
100 likes | 212 Views
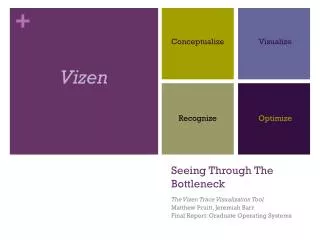
The Vizen Trace Visualization Tool, developed by Matthew Pruitt and Jeremiah Barr, aims to simplify the complexities of analyzing strace data while optimizing system performance. Given the vast and intricate nature of trace data, the tool abstracts and visualizes key points, allowing users to recognize bottlenecks efficiently. By aggregating data and presenting it through multiple views, users can make connections between trace data and system performance metrics, enabling them to filter and drill down into relevant information intuitively, supporting effective decision-making.

E N D
Conceptualize Visualize Vizen Recognize Optimize Seeing Through The Bottleneck The Vizen Trace Visualization Tool Matthew Pruitt, Jeremiah Barr Progress Report: Graduate Operating Systems
The Problem • The tool • strace • Copious amounts of data • Difficult to read for users unfamiliar with the strace syntax • Visualizing The Trace • High dimensionality in the trace • Aggregating data from trace and other processes can cause high overhead open("/lib64/libdl.so.2", O_RDONLY) = 3 read(3, "\177ELF\2\1\1\0\0\0\0\0\0\0\0\0\3\0>\0\1\0\0\0\20\16\30040\0\0\0"..., 832) = 832 fstat(3, {st_mode=S_IFREG|0755, st_size=23360, ...}) = 0 mmap(0x3034c00000, 2109696, PROT_READ|…
The Solution • Abstraction • Create multiple views showing key points in the data • Allows users to see connections between trace data and various aspects of system performance • Users can drill down to pertinent information • Allows user to easily filter the large amounts of data generated by strace • Difficulties • Combining strace with system performance measurements • Maintaining low overhead • Displaying data in such a way that the user can quickly and intuitively see bottlenecks
The Diagram of The Solution strace /proc VFS JProcExplorer JProcessParser JTraceDataModel JPerfDataModel JGanttChart JXYPlot JBarChart JGlobalView Vizen
Future Plans • Visualizations • System Calls/Second • Gantt Chart • Etc… • Program Components • Hook views together • Improve interactive functionality • Performance • Improve program performance by removing calls to outside programs • Use /proc virtual file system