Download
1 / 2
20 likes | 237 Views
Understanding Phase Diagrams of Nanoparticles William A. Jesser, University of Virginia, DMR 0639050.

E N D
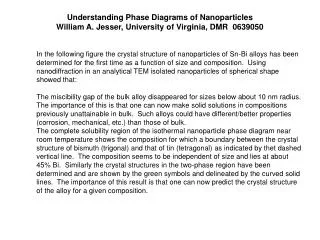
Understanding Phase Diagrams of Nanoparticles William A. Jesser, University of Virginia, DMR 0639050 In the following figure the crystal structure of nanoparticles of Sn-Bi alloys has been determined for the first time as a function of size and composition. Using nanodiffraction in an analytical TEM isolated nanoparticles of spherical shape showed that: The miscibility gap of the bulk alloy disappeared for sizes below about 10 nm radius. The importance of this is that one can now make solid solutions in compositions previously unattainable in bulk. Such alloys could have different/better properties (corrosion, mechanical, etc.) than those of bulk. The complete solubility region of the isothermal nanoparticle phase diagram near room temperature shows the composition for which a boundary between the crystal structure of bismuth (trigonal) and that of tin (tetragonal) as indicated by thet dashed vertical line. The composition seems to be independent of size and lies at about 45% Bi. Similarly the crystal structures in the two-phase region have been determined and are shown by the green symbols and delineated by the curved solid lines. The importance of this result is that one can now predict the crystal structure of the alloy for a given composition.
Understanding Phase Diagrams of Nanoparticles William A. Jesser, University of Virginia, DMR 0639050