Download
1 / 19
190 likes | 347 Views
Sound Attenuation due to Varying Thickness of Material . Nathan Smith Sijie Yu Andrew Newton. Motivation . Loud machinery common in industry Trade off between cost and sound attenuation The effect of increased thickness at various frequencies. Measuring ‘Loudness’.

E N D
Sound Attenuation due to Varying Thickness of Material Nathan Smith Sijie Yu Andrew Newton
Motivation • Loud machinery common in industry • Trade off between cost and sound attenuation • The effect of increased thickness at various frequencies
Measuring ‘Loudness’ • Loudness is determined by measuring sound pressure level • Sound pressure level is the force of a sound on a unit area • Units are (Pascal) • Decibels dB are the common way of expressing sound pressure level • Sound Pressure Level (SPL) in dB
Common Sound Pressure Levels • SPL of 90 dB or greater have potential to damage the ear • Change of 6 dB corresponds to a noise becoming twice as loud or soft
Microphone • This study analyses change in sound pressure level • The microphone’s output is voltage • Decibels for the microphone
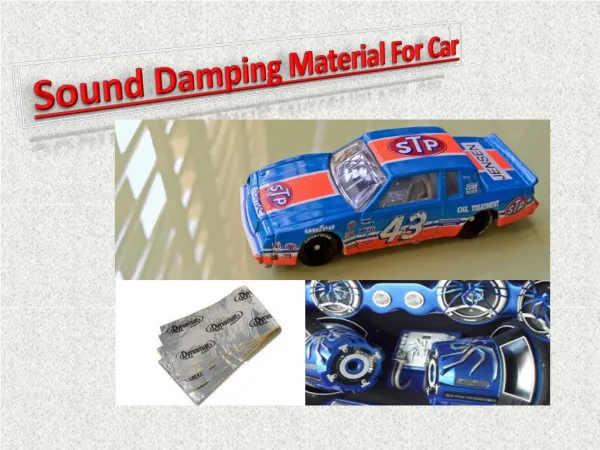
Material • Soundproofing material is expensive and difficult to set up an experiment with • Wool batting is the material used because it is easily accessible and can be formed into multiple layers • Thickness of material is the primary factor being measured so wool batting is sufficient
Supporting Structure • Base: Soup Can • Soundproofing material: Wool Batting Sheets • Support for soundproofing material: 4 Pencils & Rubber bands • Support for sound source: Folded hanger • Other material: Adhesive tape
Sound source • Android App: Frequency Sound Generator
Experimental Procedure • Step 1: Set up the apparatus • Step 2: Take reference data points at no insulation condition • Generate sound from 500HZ to 5000Hz at an increment of 500Hz • Save data points using the LabVIEW • Step 3: Add two layers of wool battings each time and repeat step 2 until there are eight layers of wool battings covering the microphone.
Data Obtained • For each trial a Fast Fourier Transform (FFT) plot was obtained • For a specific frequency measured, the voltage amplitude was only significant at the specific frequency. • Ex: For the no-cover measurement at 2500 Hz the voltage output is about . This is our data point for 2500 Hz no-cover
Data for each Layer of Insulation • Lower voltage output corresponds to reduced sound pressure level sensed by the microphone • Trend lines near bottom of the chart correspond to greater sound attenuation
Sound Pressure Level dB Change • Loudness of a sound typically measured in decibels • Change of 6 dB corresponds to half or twice the loudness depending on negative or positive change respectively
Possible Bad Data Point • The data obtained at 4500 Hz is suspect because it deviates drastically from the trend of the rest of the data • According to the dB chart, the loudness increased for all layers at 4500 Hz • No conclusions can be drawn about the insulation ability of the material at 4500 Hz without further testing
Unusable Data • Data obtained lower than 1000 Hz doesn’t display any clear trend in sound attenuation. • The 8 layer data point is the only point that reveals some sound attenuation • Low frequencies may penetrate the material easily and echo around inside the setup. Resulting in positive or neutral sound pressure level changes
Usable Data • Frequencies between 1500 Hz and 4000 Hz display the most notable and satisfying data. • As expected sound pressure level decreases with increased thickness • Data points never cross: More layers always increases sound attenuation • Largest reduction is between no-cover and 1st layer • 1st layer of insulation is biggest factor in sound attenuation
Expectations & Results • More layers, more attenuation • Real life application: Wool battings work well if noise frequency is over 1000 Hz.
Uncertainty Analysis • Environmental noise • Position change of the sound source and the sensor • Systematic error between the “true” amplitude and the measured amplitude. • Other errors are negligible due to the measurement of relative values rather than absolute values.
Conclusion • There is a strong correlation between sound attenuation and material thickness for frequencies between 1500 Hz and 4000 Hz. • The results are applicable for sound attenuation in the 1500 Hz to 4000 Hz frequency range • Sound produced by machinery typically lies in the range from 200 Hz to 2000 Hz • This data is not applicable for its intended purpose and additional tests are required • The results are inconclusive below 1500 Hz and suspicious at 4500 Hz • Additional testing in these ranges are needed