Understanding Seismic Attenuation and Anelasticity Mechanisms
Explore the complexities of seismic attenuation and anelasticity mechanisms, from geometrical spreading to intrinsic attenuation. Investigate the correlation between Superplumes and attenuation levels. Delve into wave behaviors and mechanisms to lose energy in the Earth's materials.

Understanding Seismic Attenuation and Anelasticity Mechanisms
E N D
Presentation Transcript
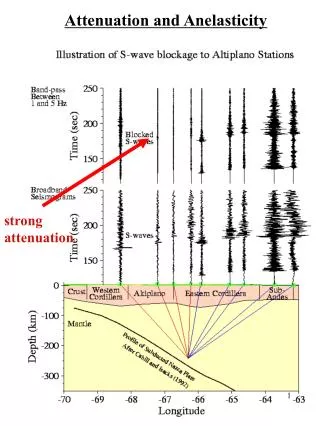
Attenuation and Anelasticity strong attenuation
Largest city on Altiplano, La Paz, Bolivia Subduction along south America, marked by Flat (<30 deg) subduction (Haschke et al., Chap 16)
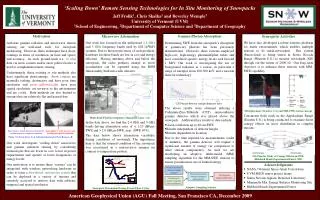
Station and Earthquake setting Stations: squares Earthquakes: solid dots Using local earthquakes to image the Q structure of the magma chamber beneath Arc volcanos. 1/Qfrom inversions * shows a red (high attenuation or low Q) zone, possibly magma chamber with melt. MT image of the same region which shows high conductivity zone (means fluid is present) Haberland et al., GRL 2003
The key here is to correlate a decrease in Q with fluids in the crust and mantle. The fluid layer again represents melting due to subduction. Myers et al., 1995
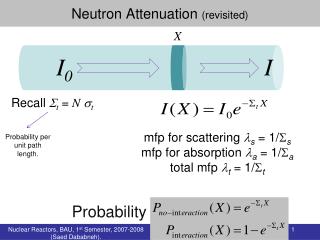
Another interesting example of attenuation The moon is a lot less attenuative, thus producing many high frequency signals. Problem: Can’t find P, S and Surface waves
Global 3D Q tomography Gung et al., 2002 Idea:Measure the amplitude difference between observed and predicted seismograms, for surface and body waves both, then invert for Q-1. The big idea here is that there appears to be a correlation between the so called “Superplumes”, which are hot mantle upwellings, with a decrease of Q. This is additional evidence that they exist, and the fact they get to the surface of the earth may imply the earth only has 1 layer, not two layers, of convection.
Imagine a light source (seismic source): Intrinsic attenuation: loss of energy to heat due to anelasticity (e.g., friction near grain boundaries) Geometrical spreading due to growing wave front surface area slow Scattering when wavelength ~ particle dimension fast Multipathing due to high & low velocity bodies
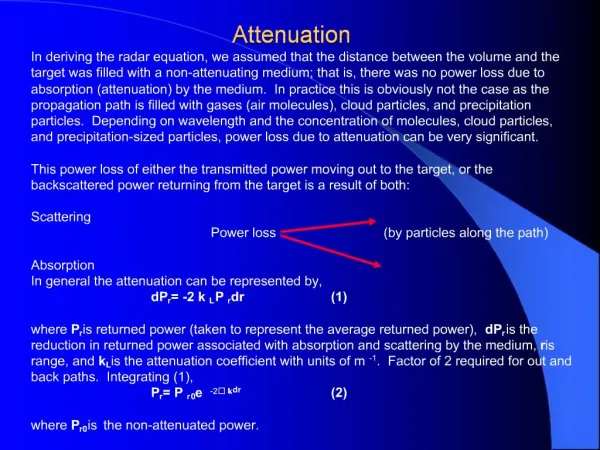
Attnuation Mechanisms: (1) Geometrical spreading: wavefront spreading out while energy per square inch or becomes less. (2) Multipathing: waves seek alternative paths to the receiver. Some are dispersed and some are bundled, thereby affecting amplitudes. (3) Scattering: A way to partition energy of supposedly main arrivals into boundary or corner diffracted, scattered energy. Key: very wavelength dependent. (4) intrinsic attenuation: due to anelasticity So far we have only concerned with purely elastic media, the real earth materials are always “lossy”, leading to reduced wave amplitudes, or intrinsic attenuation. Mechanisms to lose energy: Movements along mineral dislocations (2) Shear heating at grain boundaries These are called “internal friction”.
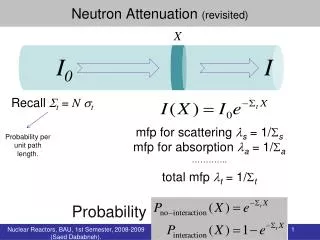
(1) geometrical spreading For laterally homogeneous earth, surface wave will spread out as a growing ring with circumference 2pr, where r is distance from the source. Conservation of energy requires that energy per unit wave front decrease as 1/r and amplitude as (1/r)1/2. Energy decays as Where for D=0 and 180, this is maximum and D=90 this is minimum (another way of understanding the antipodal behavior) Body waves amplitude decay 1/r.
(2) Effect of Multipathing Idea of Ray Tubes in body waves Angle dependent: ray bundle expands or contracts due to velocity structure. Also: amplitude varies with takeoff angle Ray tube size affects amplitudes, smaller area means larger amplitude
Wavelength: If heterogeneity bigger than l, we will get ray theory result. If smaller than l, then get diffraction result! Fast anomaly Terribly exaggerated plot of multipathing! Huygen’s principle
(3) Scattering log[A(w)] w0 Wavelength effect demonstrated for P wave coda. People use source spectrum to analyze the coda and obtain information about Q and scatters about a given path w-1 w-2 2/tr 2/td log(w)
(4) Intrisic Attenuation and Q Spring const k f m (Equation of Motion F = ma) General solution to this equation Plug in the equation: Suppose there is damping (attenuation), this becomes a damped harmonic oscillator (or a electronic circuit with a resistor): :
where Define For this second order differential equation, lets assume it has a general solution of the form where the p is a complex number and we assume the measured displacement u(t) to be the real part of this complex exponential. Substitute u(t) into equation (1) Since p is complex, we can write
Substitute in, then Equation (3) becomes Split this into real and imaginary parts: Real: Imag: Substitute (4) into (3) to solve for a:
What have we done??? (1) We have defined an angular frequency that is not exactly the original frequency w0, but a MODIFIED frequency w based on Q! (2) Lets substitute the solutions into the original solution Plot: real part of the displacement Dotted line (envelope function)