Download
1 / 26
270 likes | 408 Views
The Subprime Triggered Crisis : A Perfect Storm. Confluence of causes Past bailouts Bulletproof system!?!?? Financial innovations: Finance as end in itself Income lagging spending: Household debt…National debt Easy credit Market fundamentalism Weak global aggregate demand The Players

E N D
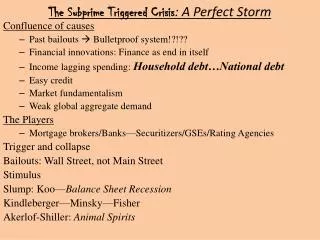
The Subprime Triggered Crisis: A Perfect Storm Confluence of causes • Past bailouts Bulletproof system!?!?? • Financial innovations: Finance as end in itself • Income lagging spending: Household debt…National debt • Easy credit • Market fundamentalism • Weak global aggregate demand The Players • Mortgage brokers/Banks—Securitizers/GSEs/Rating Agencies Trigger and collapse Bailouts: Wall Street, not Main Street Stimulus Slump: Koo—Balance Sheet Recession Kindleberger—Minsky—Fisher Akerlof-Shiller: Animal Spirits
The Subprime Triggered Crisis: A Perfect Storm Finding Fault • Past bailouts Too big/Too interconnected to Fail • Black Monday (October 19, 1987) • Asian CrisisContagionLongTermCapitalManagement (1997-8) • dot.com bubble … it takes a bubble • Financial innovations • Overnight funding • Off-balance sheet vehicles – no capital requirements • Default insurance • Collateralized Debt Obligation (CDOs) Chemistry: JunkAAA Financial Engineering
The Subprime Triggered Crisis: A Perfect Storm Finding fault • Easy Credit • Global saving glut • Fed policy: fear of deflationcheap raw material for banks • Market fundamentalism • Greenspan “put”—we’ll clean up the mess • Lax regulation • Weak global aggregate demand—saving glut • Accumulation of reserves—memories of ‘97
A “Global Saving Glut” The best of times Capital Inflows Easy Money Policy Escalating House Prices Eager Home Buyers Ambitious Mortgage Brokers Developer Clout Innovative Banks Securitization MBSs Rating Agencies Gov’t Sponsored Enterprises Bank Regulators
The best of times Capital Inflows Escalating House Prices Easy Money Policy Eager Home Buyers Ambitious Mortgage Brokers Developer Clout Innovative Banks Rating Agencies Securitization MBSs Gov’t Sponsored Enterprises Bank Regulators
Responses Lender of Last Resort / Spender of Last Resort • Tax Rebate $124 bil. • Fed Fund Rate Cuts • Fannie/Freddie $200 bil. • Bear-Stearns $29 bil. • AIG $174 bil. Fed “Facilities” • Primary Dealer Credit Facility (PDCF) $58 bil. • Treasury Security Loan Facility (TSLF) $133 bil. • Term Auction Facility (TAF) $416 bil. • Asset- Backed Commercial Paper Funding Facility (CPFF) $1,777 bil. • Money Market Investor Funding Facility (MMIFF) $540 bil. • More Fed Fund Rate Cuts … Hold At ~0% • Fed Purchases of Long-Term Securities: GSEs & MBSs $600 bil. • Term Asset-Backed Securities Loan Facility (TALF) $200 bil. • Emergency Economic Stabilization Act/TARP $700 bil. Government Loans Government Equity • Stimulus Package $787 bil. aka The American Recovery and Reinvestment Act • TARP II • Stress Tests
The Subprime Triggered Crisis: The Players Charles Kindleberger, Manias, Panics and Crashes A Minsky Story in Five Acts: In general…in particular • Displacement—A breakthrough • Financial innovation: securitization—sell off risk • Credit Expansion & BOOM • Low interest rates—defend against deflation • Shadow banking/SIVs/MBSs/CDOs/CDSs • Speculative Mania—self-fulfilling Euphoria • Teaser loans/ARMs/Home equity loans/Flipp’n’ to the bank • Distress—a Minsky/Wile E. Coyote moment
The Subprime Triggered Crisis: The Players Charles Kindleberger, Manias, Panics and Crashes A Minsky Story in Five Acts: In general; in particular • Displacement—A breakthrough • Financial innovation: securitization—sell off risk • Credit Expansion & BOOM • Low interest rates—defend against deflation • Shadow banking/SIVs/MBSs/CDOs/CDSs • Speculative Mania—self-fulfilling Euphoria • Teaser loans/ARMs/Home equity loans/Flipp’n’ to the bank • Distress—a Minsky/Wile E. Coyote moment • House prices plateau—Disappointed expectations • Panic & Crash—rush to liquidity…but there’s no liquidity • Firesale • Foreclosures • Contagion • Debt Deflation • Bailout Helicopter Ben
Minsky’s World Quasi – rents: cash flows available to pay debts PI – [supply] price of investment goods PK – [demand] price of kapital goods Borrower’s risk Lenders risk Hedge finance: E(cash flows) > Payment commitment Speculative finance: E(cash flows)<Commitment … but > Interest commitment Roll over debt Ponzi finance: E(cash flows)<Interest commitment … Expect to increase debt Financial fragility: mix of Hedge – Spec – Ponzi Good times Confidence Risk-taking Fragility
The Minsky FootprintRealized expectations Increased profits & Reduced risk BOOMDisappointed expectations Reduced profits & Confidence BustRush to liquidity Debt deflation Pk Borrower’s Risk Internal funds Marginal lender’s risk Lender’s Risk PI Investment “If the demand price of a capital asset … is not less than its replacement costs, new investment will take place.”
Akerlof and Shiller, Animal Spirits • Confidence – Keynes-Minsky • Hopes, Exuberance, Fears • Waves of optimism and pessimism • Corruption - Bad Faith Loss of Trust • S&Ls – Enron – Sub-prime • Fairness • Punish cheaters, even at own expense • Relative position • Money illusion • “Illusion” is real in view of nominal contracts/accounts • Stories • New eras – Irrational exuberance Downward wage rigidity
Disinflation, Deflation, and the Liquidity Trap • The built-in mechanism that can lift economies out of recessions is this: • Output below the natural level of output leads to lower inflation. • Lower inflation leads in turn to higher real money growth. • Higher real money growth leads to an increase in output over time. • (M/P) up i down I up Y up … until full employment is restored • This mechanism, however, is not foolproof.
A Long Slump • Spending decisions depend on real interest rate • Demand for real balances depends on nominal rate The Effects of Lower Inflation on Output When inflation decreases in response to low output, there are two effects: (1) The real money stock increases, leading the LM curve to shift down, and (2) expected inflation decreases, leading the IS curve to shift to the left. The result may be a further decrease in output.
Money Demand, Money Supply, and the Liquidity Trap A Long Slump The Liquidity Trap When the nominal interest rate is equal to zero, and once people have enough money for transaction purposes, they become indifferent between holding money and holding bonds. The demand for money becomes horizontal. This implies that, when the nominal interest rate is equal to zero, further increases in the money supply have no effect on the nominal interest rate.
A Long Slump: Liquidity Trap and Deflation The Liquidity Trap and Deflation In the presence of a liquidity trap, there is a limit to how much monetary policy can increase output. Monetary policy may not be able to increase output back to its natural level. Suppose the economy is in a liquidity trap, and there is deflation. Output below the natural level of output leads to more deflation over time, which leads to a further increase in the real interest rate, and leads to a further shift of the IS curve to the left. This shift leads to a further decrease in output, which leads to more deflation, and so on. In words: The economy caught in a vicious cycle: Low output leads to more deflation. More deflation leads to a higher real interest rate and even lower output, and there is nothing monetary policy can do about it.
The Great Depression U.S. Unemployment, Output Growth, Prices, and Money, 1929 to 1942 Year UnemploymentRate (%) Output Growth Rate (%) Price Level Nominal Money Stock 1929 3.2 9.8 100.0 26.6 1930 8.7 7.6 97.4 25.7 1931 15.9 14.7 88.8 24.1 1932 23.6 1.8 79.7 21.1 1933 24.9 9.1 75.6 19.9 1934 21.7 9.9 78.1 21.9 1935 20.1 13.9 80.1 25.9 1936 16.9 5.3 80.9 29.5 1937 14.3 5.0 83.8 30.9 1938 19.0 8.6 82.2 30.5 1939 17.2 8.5 81.0 34.1 1940 14.6 16.1 81.8 39.6 1941 9.9 12.9 85.9 46.5 1942 4.7 13.2 95.1 55.3
The Great Depression The Contraction in Nominal Money • The puzzle is why deflation ended in 1933. • One proximate cause may be the set of measures taken by the Roosevelt administration such as establishing the National Industrial Recovery Act (NIRA) of 1933. • Another factor may be that while unemployment was still high, output growth was high as well. • Another factor may be the perception of a “regime change” associated with the election of Roosevelt.
The Japanese Slump • The robust growth that Japan had experienced since the end of World War II came to an end in the early 1990s. • Since 1992, the economy has suffered from a long period of low growth—what is called the Japanese slump. • Low growth has led to a steady increase in unemployment, and a steady decrease in the inflation rate over time.
Figure 22 – 9 The Japanese Slump: Output Growth since 1990 (percent) 22-3 The Japanese Slump From 1992 to 2002, average GDP growth in Japan was less than 1%.
Figure 22 – 10 Unemployment and Inflation in Japan since 1990 (percent) 22-3 The Japanese Slump Low growth in output has led to an increase in unemployment. Inflation has turned into deflation.
22-3 The Japanese Slump The numbers in Table 22-4 raise an obvious set of questions: What triggered Japan’s slump? Why did it last so long? Were monetary and fiscal policies misused, or did they fail? What are the factors behind the current recovery?
The Rise and Fall of the Nikkei Stock Prices and Dividends in Japan since 1980 The increase in stock prices in the 1980s and the subsequent decrease were not associated with a parallel movement in dividends. • The fact that dividends remained flat while stock prices increased strongly suggests that a large bubble existed in the Nikkei. • The rapid fall in stock prices had a major impact on spending—consumption was less affected, but investment collapsed.
22-3 The Japanese Slump The Failure of Monetary and Fiscal Policy Fiscal policy was used as well. Taxes decreased at the start of the slump, and there was a steady increase in government spending throughout the decade. Fiscal policy helped, but it was not enough to increase spending and output.
The Failure of Monetary and Fiscal Policy Government Spending and Revenues (as a percentage of GDP) in Japan since 1990 Government spending increased and government revenues decreased steadily throughout the 1990s, leading to steadily larger deficits. • Output growth has been higher since 2003, and most economists cautiously predict that the recovery will continue. This raises the last set of questions. What are the factors behind the current recovery? • There appear to be two main factors. A Regime Change in Monetary Policy The Cleanup of the Banking System