Download

1 / 16
160 likes | 263 Views
This informative presentation covers the practice of analyzing and interpreting X-ray diffraction data. Learn about structure determination, indexing techniques, Rietveld method, and more. It delves into experimental and high-pressure challenges, tasks like refining structures from diffraction patterns, and processing single crystal data. Explore peak fitting, refinement, phase identification, and visualization methods using tools like PowderCell and Endeavour software. Advance your understanding of crystallography with practical applications in materials science.

E N D
Practice of analysis and interpretation of X-ray diffraction data Power Point presentation from lecture # 2 is available at: http://dl.dropbox.com/u/23622306/UIUC/Lecture%202.ppt Power Point presentation from lecture # 4 is available at: http://dl.dropbox.com/u/23622306/UIUC/lecture%204.ppt Power Point presentation from lecture # 5 is available at: http://dl.dropbox.com/u/23622306/UIUC/lecture%205.ppt Lecture # 5 software and files can be downloaded from: http://dl.dropbox.com/u/23622306/UIUC/lecture%205%20materials.zip
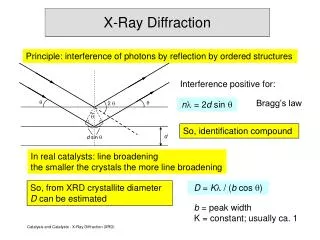
Structure determination Structure identification “Logical” choices Search and match Indexing-based Structure refinement (requires the structure model to be approximately known) Rietveld method Single-crystal refinement Structure solution (ab initio) direct methods charge flipping simulated annealing
Incident x-ray beam Incident x-ray beam Beryllium seats Beryllium seats Diamond anvil Diamond anvil Metal gasket Metal gasket Steel frame Steel frame Diffracted x-ray beam Diffracted x-ray beam High pressure apparatus • Sample is immersed in hydrostatic liquid, which freezes at some point during compression (usually below 10 GPa). • Diffraction pressure calibrant is placed in the sample chamber along with the sample. • Both incident and diffracted beam travel though diamonds, Be disks, pressure medium, and sample.
High-pressure crystallography challenges Experimental challenges: • Very small sample (<0.01mm) • Angular access restricted (low completeness) • Absorption limits the incident energy to >15 keV • Absorption and extinction affect intensity measurement • High background (scattering, Compton, etc.) • Multiple SXD diffraction signal • Contamination by PXD signal • Poor sample quality (strain, multi-grain assemblages) • More challenging sample centering • Beam size vs. sample size
Tasks for today • From 1-d diffraction pattern to refined structure • Rietveld-based quantitative analysis • From 2d powder diffraction image to solved and refined structure • Single crystal data processing • Solution and refinement of crystal structure from single crystal data using simulated annealing
Typical flow of analysis of (2d) powder diffraction data Diffraction image (2d) Integrated 1-d pattern Detector geometry calibration Calibration diffraction image from known standard
Calibration of detector geometry • Incident wavelength • Sample-to-detector distance • Beam center (point of intersection of incident beam and detector plane in detector pixel coordinates) • Detector nonorthogonality (tilt and rotation of tilting plane) CeO2: Pixel size: 0.150 Approximate sample-to-detector distance 400 mm Incident energy E=37.07 keV Density 6.9 g/cm3 Space group Fm3m (#225)
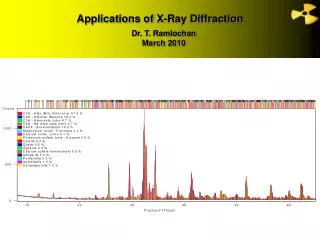
Individual peak fitting and unit cell parameter refinement (GSE_shell) • CeO2 • Identify phase with Rosetta using full database • Subtract background and refine unit cell from individual peaks in GSE_Shell • Save the pattern with subtracted background.
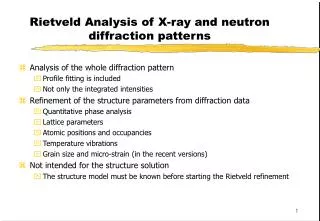
Rietveld refinement in PowderCell for single and multiple phase patterns • When does it make sense to refine a known crystal structure? • Define the phase present in the sample by looking up the corresponding crystal structure in the American mineralogist Crystal Structure database (you can search by mineral name). Either type the unit cell parameters, space group number, and fractional atomic coordinates for all the atoms, or download a .cif file. Cif format from AMCSDB may not be readable in PowderCell. In such case you can use Endeavour to convert the file format to SHELX .ins. You may need to add ZERR and UNIT lines in the ins file. • Read in experimental diffraction pattern. The best import format is Diffrac AT&Plus .raw. You can use the CONVX program for diffraction pattern format conversion. • Make sure the wavelength is set correctly. • Define proper 2theta range. • Modify selection of parameters in refinement gui. Start with just refining background and scale. Then include peak profiles and unit cell parameters. Refinement of atomic coordinates, ADPs and occupancies comes last. • Look at refinement statistics. Check bond lengths. • Save refined structure as ins file.
Visualization and interpretation of structure model using Endeavour • Create polyhedral representation of the structure. • Display table of interatomic distances. • Import the pattern with subtracted background. • How does the fit statistics compare with the Rietveld refinement statistics? How does a refinement in Endeavour differ from a rietveld refinement? • Try to erase the atoms and solve the structure using simulated annealing.
Processing of single crystal x-ray diffraction data with GSE_ADA/RSV • GSE_ADA • Define detector calibration • Search for peaks in the wide rotation image and refine their detector coordinates. • Assign omega angles by analyzing step scan images. Save a peak table file with proper Cartesian coordinates of reciprocal vectors. • RSV • Index peak and find orientation matrix. • Convert to conventional setting, if necessary. • Refine unit cell parameters. • Save the refined orientation matrix. • GSE_ADA • Open the wide rotation image again • Open the orientation matrix • Define the range of rotation • Predict peaks • Verify if all peaks are observed and if they fit correctly. • Save peak table with fitted intensities. • RSV • Analyze systematic absences with XPREP and assign space group. If necessary tarnsform the unit cell to the correct setting. • Export SHELX hkl file. • Create a corresponding ins file with structure model and refinement instructions. • SHELXL • Refine the structure in SHELX
Structure solution from single crystal XRD data using Simulated Annealing (Endeavour) • Structure solution with single-crystal peak intensity data works in Endeavour just the same was as structure solution from powder data. • Composition NiP • Z=8 • Space group Pbca • Unit cell a=4.8810A, b=6.8900A, c=6.0500° • Find fractional atom coordinates by solving the structure. Use peak intensities from all three available detector positions. • Refine the structure in SHELX.
Single crystal refinement with SHELXL http://shelx.uni-ac.gwdg.de/SHELX/
Homework (due 9/27) • Perform Rietveld refinement for all six powder patterns from the homework of lecture #4. • Try to solve the structures of minerals in the single-phase patterns using Endeavour. • Based on the crystal structure models refined with PowderCell prepare structure drawings showing the coordination polyhedra using Endeavour.