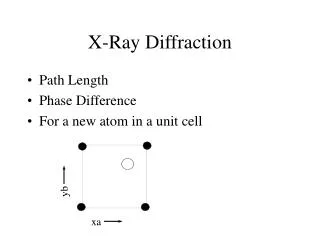
X-ray diffraction
X-ray diffraction. Muhannad Alzahrani. Supervisor: Dr. Akhtar Naqvi. Presentation Outline. Introduction Theoretical Background Experimantal Procedure Results and Discussion Conclusion. Introduction (1). X-ray was first discovered by Wilhelm Rontgen in 1895


X-ray diffraction
E N D
Presentation Transcript
X-ray diffraction Muhannad Alzahrani Supervisor: Dr. Akhtar Naqvi
Presentation Outline • Introduction • Theoretical Background • Experimantal Procedure • Results and Discussion • Conclusion
Introduction (1) • X-ray was first discovered by Wilhelm Rontgen in 1895 • The typical wavelength of of X-ray is 0.01 to 10 nm. • Mainly use in Physics to to explore the crystalls structure. • Other uses include medical CT scans and airport security devices. First X-ray Photo
Introduction (2) We have done three experiments: 1-Fine structure of characteristic X-ray for molybdenum anode. 2-determination of Plank’s constant via Duant-Hunt relation 3- diffraction of X-ray at a monocrystal (Verifying Bragg's relation)
Theoretical Background (1) • For the first experiment... • Energy is quantized (QM), and transitions are associated with emission or absorption of energy. • Fine structure → Splitting lines of transitions. • Kα and Kβ are proved to be line duplets, will be explored by means of X-ray diffraction. • These transitions obey selection rules |∆l| = 1, |∆j|=0, 1
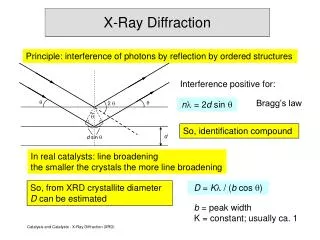
Theoretical Background (2) • For the second experiment... • Duant and Hunt found that at the Brehmsstrhlung continuum in the relative intensity and wavelength curve that • λmin~1/U, the exact relation is • λ = (hc/e)(1/U)=A / U • For the third experiment... • Crystalls are arrays of lattice elements or parallel lattice planes (Bragg). • Bragg got the relation 2d sin(θ)=nλ (constractive interference condition)
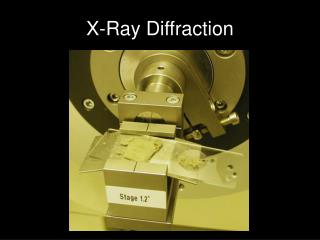
Experimental Procedure (1) • All experiments had been carried out by Leybold X-ray diffraction machine. • The device consists of three parts: • 1- Control Panal: To adjust the different • parameters involved • 2- X-ray emmitor. • 3- Experiment room: Containing an • X-ray source, the crystal and the • detector. • The last part is a cable attached to a computer to transmitt the data via X-ray apparatus software
Experimental Procedure (2) • All three experiments have almost the same procedure. • First, we need to maxmize the counting rate via manipulating the voltage and angles. • Next, we enter the relevant parameters using the control panal. • Then, we need to adjust the distances between the X-ray emitter, the crystal and the detector. • Finally, we have to choose the appropriate plot type in the X-ray apparatus software.
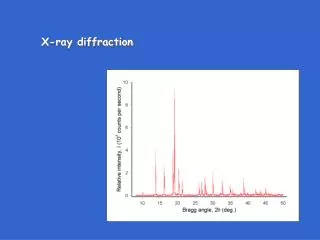
Results and discussion (1) • For the first experiment, we have done first order diffraction three consecutive times to find Kα and Kβ. • The first and second peaks corresponds to the Kβ and Kα respectivley. • The obtained values for Kα and Kβ respectivley were 73.1 and 65.0, while the literature values are 71.8 and 63.09 (Good agreement) • Yet, first order diffraction is not enough to resolve Kα1 and Kα2 First order diffraction for NACl monocrystall
Results and discussion (2) • The consecutive peaks represents Kγ, Kβ, Kα1 and Kα2 . • The obtained for Kγ, Kβ, Kα1 and Kα2 were 62.2, 63.1, 70.8 and 71.4 (pm), and the literature values were 62.09, 63.26, 70.93 and 71.36 (pm) and the agrrement is good. • The difference between the curve here and the one in the manual is the upward shift in this case. Fifth order diffraction in NACl monocrysall
Results and discussion (3) • In the third experiment, finding Plank's contant. It is done via performing the experiment for different values of the voltage and finding the corresponding λmin (Upper graph), then plot a regrssion line to find A (Lower graph). • The obtained value of h was 4.87 *10^-34 J.s, with a considerable deviation from the literature value (6.38*10^-34 J.s), error is 27% (No explanation).
Results and Discussion (4) • In the third experiment, we verified Bragg's relation. • The graph is a plot of Internsity of the diffracted beam vs. angle. • We did not calculate the wavelenghts explicitly, but the plot is almost identical to the one in the manual.
Conclusion • X-ray diffraction is an indespensible tool in many fields. • K lines of transition are duplets. • Bragg's relation is true within experimental sensitivity. • Counting rate must be high to obtain accurate results