Download
1 / 1
10 likes | 74 Views
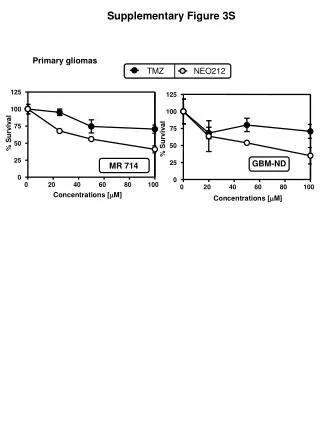
Explore the impact of TMZ and NEO212 concentrations on survival rates of primary glioma patients. This supplementary figure presents insightful data for research purposes.

E N D
Supplementary Figure 3S Primary gliomas % Survival 125 125 100 GBM-ND 100 75 75 % Survival 50 50 25 MR 714 25 TMZ NEO212 0 0 0 20 40 60 80 100 0 20 40 60 80 100 Concentrations [mM] Concentrations [mM]