Mastering Regression Techniques in Excel: A Comprehensive Guide
Dive into the world of regression analysis using Excel! This guide covers essential techniques like fitting models to data through straight-line and multilinear regression, as well as nonlinear regression. Learn to use Excel's Data Analysis Regression tool and Trendline features to minimize errors and achieve the best model parameters (slope and intercept). Understand metrics such as SSE, R², and P-values for judging model fit and significance. Whether for academic or professional use, this guide equips you with the skills to effectively analyze and interpret data models.

Mastering Regression Techniques in Excel: A Comprehensive Guide
E N D
Presentation Transcript
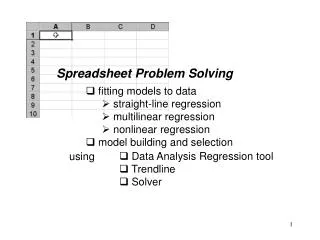
Spreadsheet Problem Solving • fitting models to data • straight-line regression • multilinear regression • nonlinear regression • model building and selection • Data Analysis Regression tool • Trendline • Solver using
Review of Straight-line Linear Regression [ from Class #6 ] y1 y = ax + b Model y y11 e11 x11 x For each data point, there is an error between that point and the model line. Fitting the model has to do with minimizing these errors.
Finding the model parameters that give the best fit For the straight-line model, the model parameters are the slope (a) and the intercept (b). The problem is then to find the values of a and b that give the best fit. What is meant by the best fit? The standard measure of goodness of fit is the sum of squares of the errors: So, the problem reduces to finding the minimum of SSE by adjusting a and b.
Fitting a straight-line model to data The minimization of SSE can be solved by calculus to give formulas for the best values of a and b: and Excel solves problems like this with either formulas or built-in tools (Data Analysis Regression & Trendline).
Transfer the data to an Excel spreadsheet and create a graph
Using the model straight-line equation to compute the predictions: and copy these to the graph, displaying as a straight line
Using an alternate, shortcut approach Trendline Start with a simple graph of the data Select the data series by clicking on it Right-click on a data point to get context-sensitive menu Select Add Trendline option
The Add Trendline dialog box Linear selected by default OK for this problem Click on Options tab
Options tab Set for Display equation on chart Click OK
Fix up equation display Initial form of graph with straight-line added
Looks just like before, but we got there quicker But neither of these approaches gives us much information about the model, how good it is, etc.
A 2nd alternate approach Data Analysis Regression tool Tools Data Analysis recall that, if Data Analysis does not appear on the Tools menu, you will need to check Analysis Toolpak in the Add-ins dialog box [if it’s not there, you will have to go back to Microsoft Office/Excel set-up] Initial, empty Regression dialog box
Regression dialog box set up for our problem checking Residuals will give us also model predictions
Format Autoformat OK Initial (poorly formatted) Regression output display [ on new worksheet ] and fix up display for appropriate significant figures
Final Display of Regression Output [ tons of info, most of which you will not understand for a couple years ] used to judge goodness of fit intercept and slope values used to judge whether terms “belong” in the model add to data graph for visual comparison with model
Judging Goodness of Fit correlation coefficient: if close to +1 or –1, indicates strong correlation between x and y [something we already know from the original graph!] coefficient of determination: %-age of the variability in y that’s accounted for by the model adjustment to R2 that penalizes the value for using a model with too many terms gives an idea of how far off the model predictions will be Adjusted R2 or Standard Error can be used to compare different models and choose which fits best. The higher the value of Adjusted R2 the better, the lower the value of Standard Error the better.
Judging whether terms belong in the model P-values estimate the probability that the true value of the coefficient could be zero P-values that are quite small, like these, indicate that there is little question about the significance of the term coefficients. In our case here, that means that both the intercept term and the slope term belong in the model. A P-value of 5% (0.05) or greater causes suspicion that the coefficient may not be significant and that the term should probably be dropped from the model
The Data Analysis Regression tool appears much morecomplicated and involved that the shortcut Trendline tool, so . . . Why use Data Analysis Regression? • It provides more information that let’s us • judge the goodness of fit and significance • of model terms 2) It can handle model forms that cannot be handled by Trendline So, generally, when using Excel, we prefer the Data Analysis Regression tool over Trendline but Trendline is still quite good for “quick and dirty” looks at the data Learn to use both!
Note: it is called linear regression, even when there are nonlinear terms in x, because the terms are linear in the model parameters, a, b, c, etc. More complicated models Polynomial models General linear models Examples: polynomial models above Multilinear models Examples:
Nonlinear models Transformable to linear Not transformable straight-line regression! We can use the Data Analysis Regression tool for everything except the nonlinear models that can’t be transformed into linear. For those, we can use the Solver.
Example: polynomial regression curvature evident
Setting up for polynomial fits Select for quadratic model, etc
Data Analysis Regression tool check Labels because headings are included in selections for Y and X check Residuals
Quadratic model regression results model performance adjR2 model coefficients copy to graph
Continue with fits of cubic, 4th- & 5th-order polynomials Summary of results Looks like 5th-order offers best performance but improvement is marginal over 4th-order. Resulting model:
Precautions on polynomial fitting Try to use the lowest-order model that gives a good fit. Higher-order models will have “wiggles” between data points that will cause prediction errors. In fact, an (n-1)th-order polynomial will provide a perfect fit to the n data points, but it will usually do bizarre things in between the data points.
Example: multi-linear regression Model 1: Model 2: X-input range includes two independent variables: x1 and x2 High P value for intercept in Model 1 suggests Model 2 without intercept, but there is a significant loss in adjR2
Model performance isn’t that great for either model, and Model 1 doesn’t appear dramatically better than Model 2 Note: for multi-linear models, we plot Predicted vs Measured y. A perfect model would place points directly on the 45-degree line.
Nonlinear Regression Fitting the parameters of the van der Waals’ equation of state Data for SO2 Find the values of a and b that give the best predictions for P, when compared to the measured values of P
2) compute predicted P’s using data for and T Strategy for Nonlinear Regression 1) estimate initial values for a and b 3) compute errors between predicted P’s and measured P’s 4) sum the squares of these errors to compute SSE 5) have the Solver minimize SSE by adjusting the values of a and b
- Basic data Calculated Pressure by both ideal gas law and van der Waals Sum of squares of this column
Ideal Gas Calculation Sum of Squares Calculation van der Waals Calculation Error Calculation
Setting up Solver Parameters SSE as Target Cell Minimize by adjusting a and b with b>=0 constraint Results
Note departure of ideal gas predictions at higher pressures