Understanding Z-Scores and Normal Model
80 likes | 179 Views
Learn how to standardize data using Z-scores in statistics. Graphs, measures of spread, and transformations explained. Understand normal distributions and percentiles.

Understanding Z-Scores and Normal Model
E N D
Presentation Transcript
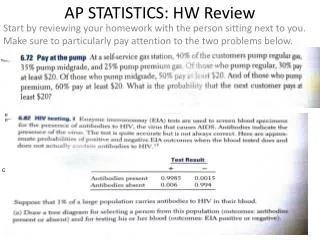
AP Statistics Review Standardizing Data and Normal Model(C6 BVD) C6: Z-scores and Normal Model
Imagine a list of data, such as (1,3,5,7,9). • If you add/subtract something to all the data, what happens to center (mean)? Spread (Sx)? • If you multiply/divide all the data by something, what happens to center? Spread? • If you subtracted the mean from all the data, what would the mean of the transformed list be? • If you divided all data in that list by Sx, what would the new standard deviation be? Transforming Data
When you transform the data by subtracting the mean and dividing by Sx, the new list of data has a mean of 0 and a standard deviation of 1. You can do this to any data, no matter the shape of the distribution, units, etc. • If we then use the standard deviation as a “yard stick” to see how extraordinary a particular value is, we can compare values from any data sets, no matter how different the original distributions were. We can compare 100m dash times with discus tosses, etc. • Z = (value – mean)/Sx • A z-score tells you how many standard deviations above/below the mean a result is. The farther away it is from the mean, the more extraordinary or unusual it is. Standardized value (Z-score)
Sometimes the overall pattern of a large number of observations is so regular we can describe it by a smooth curve, called a density curve. • The area under a density curve is always 1. • The area under the curve between any two intervals is the proportion of all observations that fall in that interval. • Median – divides curve into equal areas. • Mean – the balance (see-saw) point. • Median = Mean if the curve is symmetric. If it isn’t, mean is pulled in the direction of skew (the long tail). Density Curves
Normal curves are a very useful class of density curves. They are symmetric, unimodal, bell-shaped. They are described by N(mean, standard deviation) –these are parameters, not statistics • The points of inflection are one standard deviation to either side of the mean. • There are an infinite number of normal curves. Your z-table is for the STANDARD NORMAL CURVE which has been transformed to a mean of zero and standard deviation of 1 (i.e. standardized to use with z-scores). • 68-95-99.7 rule Normal Distributions
The distribution of heights for U.S. women can be modeled by N(64.5,2.5) • What % have heights over 67? • Between 62 and 72 inches? • What if z-score is somewhere between the standard deviations? – Use z-table or calculator --Distributions menu – normalcdf(lower bound, upper bound) • Less than 5 feet? Z = -1.8 • Remember: area in table is LEFT-side area. Example
Example: Blood cholesterol level in mg/dl of teens boys can be described by N(170,30). What is the first quartile of the distribution? • 1st quartile – 25th percentile. • Find .2500 or closest in z-table – read z. • Calculator – use invnorm(.25) – must write percentile as decimal. • Use z-score equation z = (x-170)/30 to solve for x. Finding Normal Percentiles
Not every density curve that looks normal really is normal. Never say something is “normal” if is really is only approximately normal or just unimodal/symmetric. • How to check: • 1. Plot data in a dotplot, stemplot or histogram. Is data unimodal, symmetric, bell-shaped? • 2. Does the 68-95-99.7 rule work? – Find mean and standard deviation. Are about 68% of data points within 1 Sx of mean? (etc.) • 3. Can use Normal Probability Plot on TI-calculator – look for straight diagonal line. • 4. If data are not approximately normal, you can still find z-scores, but you cannot use 68-95-99.7 rule or z-table to find probabilities/areas/proportions under the density curve. Is it Normal?