AP Statistics Inference Review
AP Statistics Inference Review. Chapters 18-25. Remember Your Formulas. 1 Proportion: CI = Hypothesis Test: z = . 1 Sample or Matched Pairs t-test CI = Hypothesis Test: t df = . 2 Proportion: CI = Hypothesis Test: z = . 2 Sample t-test: CI: Hypothesis Test: t df =.

AP Statistics Inference Review
E N D
Presentation Transcript
AP StatisticsInference Review Chapters 18-25
Remember Your Formulas 1 Proportion: CI = Hypothesis Test: z = 1 Sample or Matched Pairs t-test CI = Hypothesis Test: tdf = 2 Proportion: CI = Hypothesis Test: z = 2 Sample t-test: CI: Hypothesis Test: tdf =
Remember PANIC for CI’s and PHANTOMS for Hypothesis Tests Parameter Assumption Name Test and Statistics Interval (Include Formula) Conclusion Parameter Hypothesis (p or mu) Assumptions/Conditions Name Test Test Statistics Obtain P (Include formula and distribution) Make Decision (Never accept Ho State Conclusion (In Context)
Name Statistics: n = 50, p-hat = .7, q-hat = .3 Interval: Conclusion:
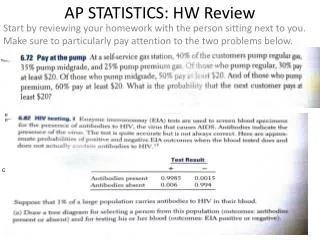
Parameter: p = proportion of city workers who are also in the union Hypothesis: Independent: Each person being in The union should be independent
Name: One proportion z-test Test Statistics: p-hat = .12, p = .135, q = .865, n = 2000 Obtain P: Decision: Conclusion:
Parameter: Assumptions:
Name: 2 Proportion z-Interval Interval: Conclusion:
Parameter: Ps = Proportion of suburban students that failed AP exam Pr = Proportion of rural students that failed AP exam Hypothesis: Ho: Ps = Pr, Ha: Ps≠ Pr Assumptions: 10%: Both 107 and 143 are less than 10% of rural and suburban students that took AP exam.
Name: 2 Proportion z-test Test Statistics: Make Decision: Fail to reject Ho State Conclusion: Obtain P: P =.56
Parameter: Name Test: Interval: Assumptions: Random: It is a random selection of days during the year. Nearly Normal: The histogram is roughly unimodal and symmetric Independent: Each car’s speed should be independent 10%: 20 cars is less than 10% of all cars that pass through when the sign is flashing Conclusion:
Parameter: U = average # of hours students watch TV per week from Central High Hypothesis: Ho: U = 13, Ha: U > 13
Name Test: Assumptions: Test Statistics: Obtain P: Nearly Normal: Histogram is roughly unimodal and symmetric. Random: Students were randomly selected Independent: TV watching among students should be independent 10%: 25 students is less than 25% of all students at CHS. Conclusion:
Parameter: Assumptions:
Name: Interval: Conclusion:
Parameter: Um = mean death age of men, Uw = mean death age of women Hypothesis: Ho: Um = Uw, Ha: Um < Uw Assumptions:
Name Test: Conclusion: Test Statistics: Obtain P:
Parameter:Ud = The mean difference in unemployment rate between Australia and UK Assumptions:
Assumptions continued: Nearly Normal: Histogram is roughly unimodal and symmetric 10%: 1990 – 2000 represents less than 10% of All of the years Name: Conclusion: Interval:
Parameter:Ud = The mean difference in employment rate between Males and Females Hypothesis:
Assumptions: Name: Match paired t-test Test Statistics: Obtain P: Make Decision: Fail to reject Ho State Conclusion: