Download
1 / 28
280 likes | 397 Views
Using digital soil mapping for enterprise suitability assessment in support of Tasmanian irrigation development.

E N D
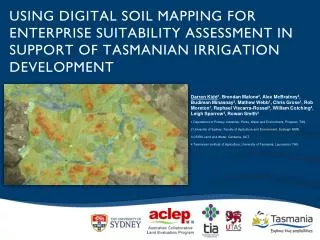
Using digital soil mapping for enterprise suitability assessment in support of Tasmanian irrigation development Darren Kidd1, Brendan Malone2, Alex McBratney2, Budiman Minasnay2, Mathew Webb1, Chris Grose1, Rob Moreton1, Raphael Viscarra-Rossel3, William Cotching4, Leigh Sparrow4, Rowan Smith4 1 Department of Primary Industries, Parks, Water and Environment, Prospect, TAS. 2 University of Sydney, Faculty of Agriculture and Environment, Eveleigh NSW. 3 CSIRO Land and Water, Canberra, ACT. 4 Tasmanian Institute of Agriculture, University of Tasmania, Launceston TAS.
Wealth from Water • Wealth from Water Pilot Program – 2 Year, joint initiative between The Tasmanian Department of Primary Industries, Parks, Water & Environment (DPIPWE), the Tasmanian Institute of Agriculture (TIA), and the Department of Economic Development, Tourism & the Arts (DEDTA) • Develop a Decision Support Tool - Enterprise Suitability Assessment to aid irrigation development in Tasmania for a range of different enterprises • AIMS: • Generate comprehensive soil, climate, crop and enterprise suitability data. • Classify Land (within Tasmanian Irrigation Schemes) according to its suitability for various agricultural enterprises (Approximately 70,000ha as a pilot, 20 Enterprises) • Provide Farm Business Planning Tools, Market and Technological Information to help farmers or investors develop, diversify or intensify into new irrigated enterprises
Pilot Areas • Total - 70,000 ha • Meander Irrigation Scheme, (43,000 ha) • Midlands Irrigation Scheme (Tunbridge District, 27,000 ha) Areas chosen to cover a diverse range of soils, existing land uses, terrain and climatic conditions
Existing Data Inadequacies…….. Only available mapping– 1:100,000 Quamby (1959) and Interlaken (1963) – partial coverage Highly complex alluvial plains – mapped as one Miscellaneous Soil Unit Soil Property (eg. pH) would be determined from a Modal Soil Type applied to entire polygon
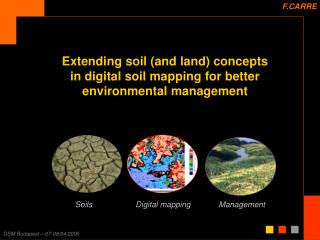
approach • Digital Soil Mapping Approach (Predictive Soil Mapping – raster based, associated uncertainties of predictions) • Sp/Sc= ∫(S,C,O,R,P,A,N) • DPIPWE has formed partnerships with the University of Sydney (Faculty of Agriculture and Environment) to apply and develop departmental capacity in the latest Digital Soil Mapping (DSM) techniques, through and ARC linkage Project. • There has also been collaboration with the Australian Collaborative Land Evaluation Program (ACLEP). • Radiometric Mapping • MiRanalyses • DSM training Soil Data (point and/ or polygon) Climate (rainfall, temp) Organisms (vegetation, land use) Relief (DEM terrain analysis) Parent Material (geological maps) Age (age of material, temporal components) N (spatial coordinates, spatial variability) ……..McBratney et al 2003
ESM Requirements • Based on Enterprise-Specific Soil; Terrain; and Climate Parameters • pH (water) 0 to 15cm • ECse 0 to 15cm • Clay% 0 to 15cm • Soil Drainage Class (Yellow Book) • Stone% Class (2 to 200mm, > 60mm, >200mm) 0 to 15cm • Soil Depth/ Depth to Impeding Layer • Depth to Sodic Layer (ESP > 6%) • Duplex Clay Presence @ 0 to 40cm (carrots) • ExchCa 0 to 15cm (onions) • Exch Mg 0 to 15cm (onions) • Slope % • Frost Risk (Enterprise time specific) • Heat Risk (Enterprise time specific) • Rainfall (Enterprise time specific) • Chill Hours (Enterprise time specific) • Growing Degree Days (Enterprise time specific) • Map Suitability for 20 different enterprises • Poppies • Carrots • Carrot Seed • Barley • Blueberries • Hazelnuts • Industrial Hemp • Pyrethrum • Rye Grass • Lucerne • Cherries • Wheat • Onions • Strawberry • Raspberry • Potatoes • Wine grapes • Linseed • Olives
Sample Suitability Rule *Uses Most-limiting Factor approach
Methods • Logistics • 30m Resolution Mapping • 930 soil cores (650 training/ 280 validation) • 271 temperature sensors (tiny-tag loggers) • 6 climate stations – temperature, humidity, rainfall • Covariates (Explanatory Environmental Variables) • Legacy Soil and Land Capability Mapping • Land Use Mapping • Geology • SRTM-DEM and terrain derivatives (Slope, TWI, MrVBF, MrRTFetc) • NDVI/ FVC (SPOT, RapideEye, LandSat) • Gamma Radiometrics (Dose, U, Th, K) • PredictionMethods • Regression Trees (Cubist/ R) (Continuous Data) • Logistic Modeling (See5) (Discrete/ Ordinal Data) • Random Forests (R) • Universal Kriging/ Regression Kriging (SAGA/ R) • Artificial Neural Networks (R/ JMP)
Methods • Sampling • Condition Latin Hyper-cube (stratified covariates) • Fuzzy k-means Clustering (stratified-random) • Data Collection • “Yellow Book” field descriptions • Soil Cores sampled by horizon to 1.5m • MiR analyses (with 15-20% wet-chem calibrations) • Fitted Depth-Splines for standardised depths • Validation • Independent Sites, sampled at time of training sampling • Soil Property Uncertainty • Upper/ Lower Limits (based on distance to fuzzy k-means centroids of covariates used for prediction) • Suitability Model • Most-limiting factor • Queries based on Enterprise Suitability rules, trials, industry experts, agronomists (TIA) • Compiled with ESRI Model-builder • Suitability Uncertainties/ Probabilities • Monte-Carlo simulations, based on suitability classification for each parameter, for each pixel, between the upper and lower limits (normally distributed)
Suitability Models Pyrethrum Land Suitability Model – applies rules for each enterprise to soil and climate surfaces – results in a Land Suitability Rating plus the limitations for each 30m pixel
Soil Property Surfaces pH (0 to 15cm) Tunbridge – Cubist Training (Lin’s) Concordance* = 0.82 Validation Concordance = 0.45 Residual Standard Error = 0.23 *Concordance – correlation coefficient around the 1:1 line
Soil Property Surfaces Soil Drainage Index Cubist - training Cubist - validation
Soil Property Surfaces Soil Depth (cm) Coarse Fragments 2 to 200mm R-2 Validation = 0.56 Concordance = 0.69
Climate mapping - methodology • Locate temperature loggers in the study areas at adensity of 1 logger per 250ha, using stratified random sampling of terrain covariates • Record temperature for 1 year at 10 minute intervals • Correlate to surrounding Bureau of Meteorology (BOM) stations to obtain a linear relationship, use equation to derive 20 years worth of temperature data at daily and hourly intervals for each logger • Model climatic parameters using spatial interpolation (via adopted DSM techniques) to model the quantified risk values (i.e. frost risk) of each logger.
Example of grid generated from BOM station recordings (1/10/2011) Maximum temperature for 1/10/2011 Logger data correlated with BoM historical data at for corresponding grid Using Elevation as explanatory variable Minimum temperature for 1/10/2011 A total of 7305 temperature grids produced!
Coefficient of determination (R2 ) obtained between temperature logger readings and grids produced from BOM station recordings using 3 months worth of temperature logging data (1/08/2012 to 1/11/2012).
Sample Surfaces The risk of having at least one day where minimum temperature is less than -2 degrees for the period between 15 September to 15 October: Validation RMSE = 14% Validation Concordance = 0.81 R2 value= 0.72 Ratio of performance to deviation = 1.79 (i.e. a value above 1.4 indicates a reasonable model)
Sample Surfaces Growing degree days: Validation RMSE = 54.44 Validation Concordance = 0.82 R2 value= 0.66 Ratio of performance to deviation = 1.70 (i.e. a value above 1.4 indicates a reasonable model)
Sample Surfaces Chill hours: Validation RMSE = 36.11 Validation Concordance = 0.92 R2 value= 0.85 Ratio of performance to deviation = 2.44 (i.e. a value above 2 indicates a good model)
20 Enterprise Suitability Surfaces • CLIMATE • Regression kriging produces the most consistent results (due to spatial correlation between loggers). • Random Forestsand Cubist are also generating good results and in some instances have produced improved results compared to RK. • DSM • Cubist/ See5 approach working well with both measured and described data • Random Forests/ ANN tend to over-fit (better training fit/ poorer validation fit)
Suitability Surfaces • Pyrethrum – Main Limitations • Frost • Drainage • Stone% • Raspberries – Main Limitations • Frost • Drainage • pH • EC
Parameter Uncertainties Exchangeable Ca (meq/ 100g) – 0 to15cm Fuzzy k-means clusters • Derive upper and lower limits by determining Mahalnaobis Distance of each pixel prediction to the Fuzzy k-mean cluster centroids of the covariates used for predictions • The better the prediction validations, the lower the margin between the limits Eg. Exch. Ca = 7 +/ 2.1 (Upper limit = 9.1, Lower Limit = 5.9) (meq/100mg)
Suitability Probability Ratings • Assume values between the error boundsfor a soil property are normally distributed • Use Monte-Carlo simulations to randomlysample (10,000 times) between the upperand lower limits (the majority will be around the predicted value due to a ‘normality’ constraint), based on suitability rules • Tally the number of suitability ratings obtained for each parameter for each enterprise for each pixel • eg. for pH – Obtain 7880 times ‘suitable’, 2100 times ‘marginally suitable’, 10 times ‘unsuitable’……….. • Gives a 79% probability of being suitable for an enterprise based on pH at that pixel, and 21% probability of being marginally suitable
Final Outputs - (UNDER REVIEW) www.theLIST.tas.gov.au
Future: “Enterprise Diversity Index” (Combined All Suitability Surfaces)
Acknowledgements: • Chris Grose1, Rob Moreton1, Mathew Webb1, Zhuo Wang1, Regan Parkinson1, Rhys Stickler1, Peter Voller1, Ashley Bastock5,Robin Allchin1, Brendan Malone2, Alex McBratney2, Budiman Minasny2, Raphael Viscarra Rossel3, Seija Tuomi3, Peter Wilson3, Bill Cotching4, Leigh Sparrow4, Rowan Smith4, Fiona Kerslake4, Land Owners of the Study Areas, CSBP • 1 Department of Primary Industries, Parks, Water & Environment, Tasmania • 2 University of Sydney, Faculty of Agriculture and Environment • 3 ACLEP/ CSIRO Land & Water • 4 Tasmanian Institute of Agriculture (TIA) • 5 Irrigation Tasmania