Pancreas Transplants: Survival Rates and Risk Factors Analysis in USA 2004-2008
This study examines patient and pancreas graft survival rates, major causes of patient death, higher and lower risk factors for survival, and pancreas graft function in primary deceased donor pancreas transplants in the USA from 2004 to 2008. It analyzes the impact of preservation time, donor age, technical failure rate, immunological graft loss, and hazard ratios related to graft thrombosis. The data covers both short-term and 1-year outcomes post-transplant, highlighting the importance of considering multiple risk factors for successful outcomes.

Pancreas Transplants: Survival Rates and Risk Factors Analysis in USA 2004-2008
E N D
Presentation Transcript
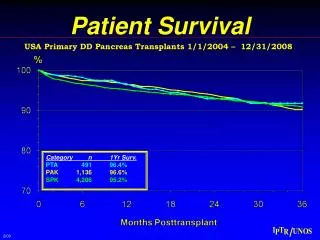
Patient Survival USA Primary DD Pancreas Transplants 1/1/2004 – 12/31/2008 Category n 1Yr Surv. PTA 491 96.4% PAK 1,136 96.6% SPK 4,206 95.2% 2/09
Major Causes of Patient Death USA Primary DD Pancreas Transplants 1/1/2004 – 12/31/2008 % SPK PAK PTA 0-3 3-12 > 12 0-3 3-12 > 12 0-3 3-12 > 12 Months Posttransplant 3/09
1-Year Patient Survival USA Primary DD Pancreas Transplants 1/1/2004 – 12/31/2008 3/08
Higher Risk Lower Risk Factors for Patient Survival USA DD Primary Pancreas Transplants, 1/1/2004 – 12/31/2008
Pancreas Graft Function USA DD Primary Pancreas Transplants 1/1/2005 – 12/31/2009 Cat. n 1Yr Fxn SPK 4,146 85% PAK 947 79% PTA 465 78% p < 0.0001 3/10
Pancreas Graft Function USA DD Primary Pancreas Transplants 1/1/2004 – 12/31/2008 DWFx Pancreas censored Cat. n 1Yr Fxn PAK 1,136 81.0% PTA 491 81.0% SPK 4,200 88.2% p < 0.0001 3/09
Major Causes of Px Graft Failure USA Primary DD Pancreas Transplants 1/1/2004 – 12/31/2008 % SPK PAK PTA 0-<3 3-<12 ≥ 12 0-<3 3-<12 ≥ 12 0-<3 3-<12 ≥12 Months Posttransplant 3/09
1-Year Pancreas Graft Function USA DD Primary Pancreas Transplants 1/1/2000 – 12/31/2007 4/06
Higher Risk Lower Hazard Ratio for Pancreas Graft Loss USA DD Primary Pancreas Transplants, 1/1/2000 – 12/31/2005 PTA SPK PAK Donor Age
Higher Risk Lower Hazard Ratio for Pancreas Graft Loss USA DD Primary Pancreas Transplants, 1/1/2000 – 12/31/2007
1-Year Pancreas Graft Function USA DD Primary Pancreas Transplants 1/1/2000 – 12/31/2006 4/08
1-Year Pancreas Graft Function USA DD Primary Pancreas Transplants 1/1/2000 – 12/31/2006 4/06
Higher Risk Lower Hazard Ratio for Pancreas Graft Loss USA DD Primary Pancreas Transplants, 1/1/2000 – 12/31/2005 SPK PAK PTA Preservation Time [hrs]
Technical Failure Rate USA DD Primary Pancreas Transplants 1/1/2000 – 12/31/2005 P = 0.0001 Donor Cause of Death
Graft Thrombosis Rate USA DD Primary Pancreas Transplants 1/1/2000 – 12/31/2005 P = 0.0001 Donor Cause of Death
Higher Risk Lower Hazard Ratio for Technical Failure USA DD Primary Pancreas Transplants, 1/1/2000 – 12/31/2005 SPK PAK PTA Donor Age
Higher Risk Lower Hazard Ratio for Graft Thrombosis USA DD Primary Pancreas Transplants, 1/1/2000 – 12/31/2005 SPK PAK PTA Donor Age
Higher Risk Lower Hazard Ratio for Graft Thrombosis USA DD Primary Pancreas Transplants, 1/1/2000 – 12/31/2005
Immunological Pancreas Graft Loss USA Primary TS DD Pancreas Transplants 1/1/2004 – 12/31/2008 Cat. n 1Yr Loss PTA 445 6.0% PAK 1,016 5.5% SPK 3,879 2.1% p = 0.0001 3/09
Even the Highest Risk Patients Do Better with a SPK than Remaining on the Waiting List UNOS Pancreas Waiting List 1/1/1995– 5/31/2003 University of Minnesota SPK Recipients 2/04